
India has seen extraordinary successes in its recent energy development, but many challenges remain, and the Covid‐19 pandemic has been a major disruption. In recent years, India has brought electricity connections to hundreds of millions of its citizens; promoted the adoption of highly‐efficient LED lighting by most households; and prompted a massive expansion in renewable sources of energy, led by solar power. The gains for Indian citizens and their quality of life have been tangible. However, the Covid‐19 crisis has complicated efforts to resolve other pressing problems. These include a lack of reliable electricity supply for many consumers; a continued reliance on solid biomass, mainly firewood, as a cooking fuel for some 660 million people; financially ailing electricity distribution companies, and air quality that has made Indian cities among the most polluted in the world.India is a major force in the global energy economy. Energy consumption has more than doubled since 2000, propelled upwards by a growing population – soon to be the world’s largest – and a period of rapid economic growth. Near‐universal household access to electricity was achieved in 2019, meaning that over 900 million citizens have gained an electrical connection in less than two decades.The Covid‐19 pandemic has disrupted India’s energy use; our updated assessment shows an estimated fall of about 5% in the country’s energy demand in 2020 due to lockdowns and related restrictions, with coal and oil use suffering the biggest falls. The pandemic has also hit investment in the energy sector, which fell by an estimated 15% in 2020, exacerbating financial strains across the board, in particular among India’s electricity distribution companies. How long the impacts last will depend on how quickly the spread of the virus is brought under control, and on the policy responses and recovery strategies that are put in place.

Over 80% of India’s energy needs are met by three fuels: coal, oil and solid biomass. Coal has underpinned the expansion of electricity generation and industry, and remains the largest single fuel in the energy mix. Oil consumption and imports have grown rapidly on account of rising vehicle ownership and road transport use. Biomass, primarily fuelwood, makes up a declining share of the energy mix, but is still widely used as a cooking fuel. Despite recent success in expanding coverage of LPG in rural areas, 660 million Indians have not fully switched to modern, clean cooking fuels or technologies.The Sustainable Development Scenario (SDS) takes a different approach, working backwards from specific international climate, clean air and energy access goals, including the Paris Agreement, and examining what combination of actions would be necessary to achieve them.
Introducing the India special focus
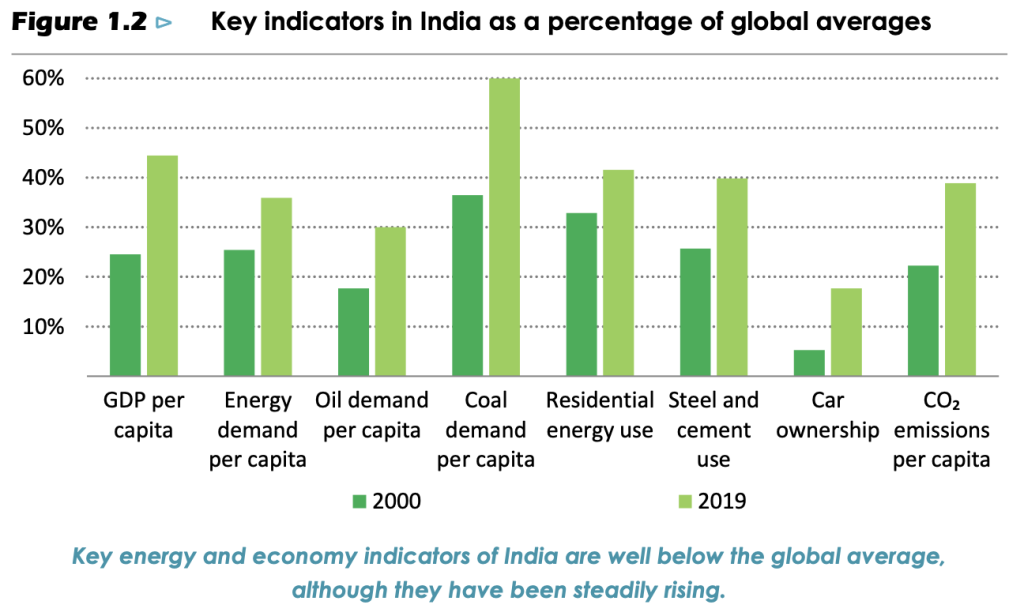
It has been six years since the International Energy Agency (IEA) last completed a special focus on India in its World Energy Outlook series. This new report updates and expands the analysis of India, and it does so from the exceptional starting point of 2020. Many things have changed in India and in global energy since the last India Energy Outlook was published, but the Covid‐19 pandemic has caused more disruption to the energy sector than any other event in recent history. The impacts will continue to be felt, in India and around the world, for years to come.However, while the pandemic affects the new Outlook in numerous ways, it does not alter the fundamental considerations underpinning this special focus on India. The potential for growth in energy demand and energy infrastructure in India remains enormous. How these needs are met will have a crucial impact on the aspirations of what will soon become the world’s most populous country. It will also have a huge influence on global trends, including the prospects for a successful global response to climate change.Since 2000, India has been responsible for more than 10% of the increase in global energy demand. On a per capita basis, energy demand in India has grown by more than 60% since 2000, although there are widespread differences across different parts of the country as well as across socio‐economic groups. On a range of economic and energy‐related indicators, India has been catching up with the rest of the world in recent years (Figure 1.2). Coal demand per capita increased from 25% of the world average in 1990 to 60% in 2019 and, mainly for this reason, carbon dioxide (CO2) emissions per capita increased from a little over 15% of the world average to a little under 40% over this period.
India is characterised by the co‐existence of shortage and abundance in several parts of its energy system. India possesses the world’s fifth‐largest coal reserves, but nonetheless is one of the world’s major coal importers. India is a major centre for global oil refining, but relies overwhelmingly on imported crude. Many consumers face unreliable electricity supply, and there are significant commercial and technical losses at the distribution level, but in aggregate there is currently a surplus of generation capacity over demand. There is significant potential consumer demand for liquefied natural gas (LNG), but this cannot always be met because of infrastructure bottlenecks and pricing constraints.The choice of per capita or absolute values for India makes a big difference in the way India looks in energy terms. The absolute values are large and growing, while per capita values remain low by international standards. Despite India being one of the world’s largest energy users, Indians on average still consume significantly less than their counterparts elsewhere in the world, and much less than in advanced economies. India’s annual CO2 emissions are now the third‐highest in the world, but barely make the top 100 as measured by emissions per capita, and are lower still if historical emissions per capita are considered.

Mapping India’s energy system
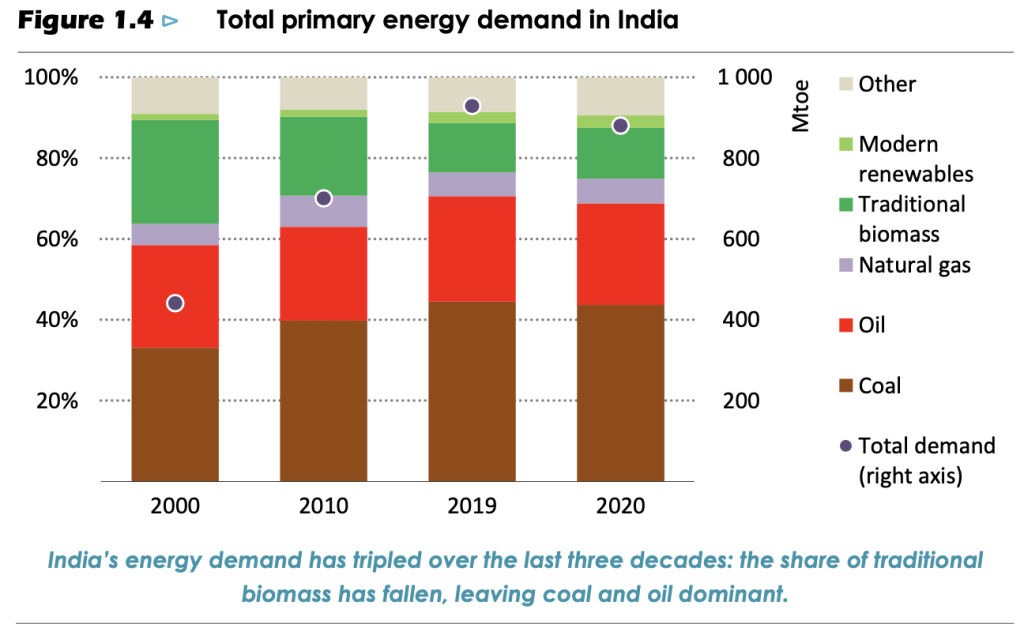
India’s energy needs are largely met by three fuels – coal, oil and biomass. These sources have, in aggregate, consistently met over 80% of India’s total energy demand since 1990. Coal has strengthened its role as the dominant energy source, maintaining its strong position in power generation as well as being the fuel of choice for many industries (especially heavy industries such as iron and steel). Coal demand nearly tripled between 2000 and 2019, accounting for half of primary energy demand growth. Today, coal meets 44% of India’s primary energy demand, up from 33% in 2000. Coal has played a significant role in India’s economic development while also contributing to air pollution and growing GHG emissions.Traditional biomass – primarily fuelwood but also animal waste and charcoal – was the largest energy source in India in 2000 after coal, constituting about one‐fourth of the primary energy mix. Overall energy demand has doubled since then, but the share of traditional biomass in the energy mix has been decreasing: it fell to 12% in 2019, largely as a result of efforts to improve access to modern cooking fuels, in particular LPG.
Electricity consumption has nearly tripled over the past two decades – growing faster than total energy demand – as urbanisation and rising incomes push up the use of household appliances. Industry has also contributed to the increase in electricity demand through its increasing use of electrical motors and other machinery. On the supply side, coal remains the predominant force in the power sector, contributing over 70% of total generation in 2019. Solar PV and wind accounted for 18% of the capacity mix in 2019, but their combined share of generation was less than 10%.


The rapid growth of mobility has been enabled by the expanding road network in India, which increased from 3.3 million km in 2000 to 5.9 million km in 2016 (MoRTH, 2019). India’s total road network is now the second‐largest in the world, behind the United States.Indians are also travelling on rail twice the distance they did in 2000. India’s per capita distance travelled on rail increased from 430 km in 2000 to nearly 860 km in 2019 (Figure 1.11). With over 8 billion trips annually, rail continues to be one of India’s most preferred ways to travel (Ministry of Railways, 2019). Freight activity similarly more than doubled on India’s vast railway network, reaching 740 billion tonne kilometres (tkm) in 2018, although the share of freight that moves on railways has been falling.

While air travel remains out of reach for most Indians, there has been a steady growth in India’s aviation industry over the past decade. The per capita distance flown in India was 110 km in 2019, which is three times as much as 10 years ago. Domestic passenger numbers, too, have nearly tripled in the last decade to over 140 million, up from around 50 million in 2010 (DGCA, 2019). There has been an increase in short‐distance flights in recent years, enabled by policies that have supported the development of small airports and made flying more affordable. India has added 50 domestic airports in the past five years, taking the total to about 150 airports with commercial operations.
Number of clean air days in India, 2019
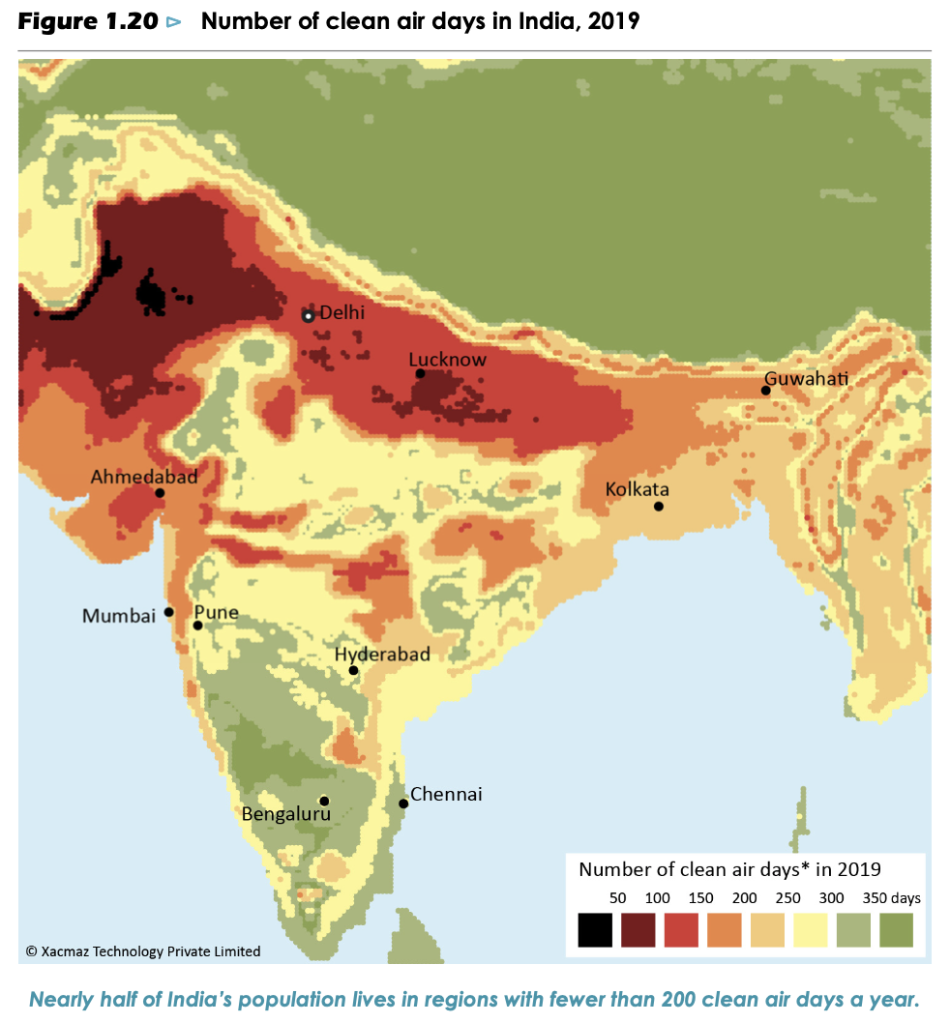
Notes: Clean air days are defined as days where the 24‐hour average of fine particulate matter (PM2.5) was lower than the CPCB safe limit of 60 microgrammes per cubic metre. This map is without prejudice to the status of or sovereignty over any territory, to the delimitation of international frontiers and boundaries and to the name of any territory, city or area. Source: Blue Sky Analytics (2020).

Economic and population growth
Alongside energy policies, the other principal determinants of energy demand growth in our scenarios are the rates at which economic activity and population are assumed to grow. 1 These indicators are naturally subject to a wide level of uncertainty, which has been exacerbated – particularly for the economy – by the effects of the Covid‐19 pandemic. With this in mind, this India Energy Outlook considers multiple possible trajectories for future growth in India’s GDP.After an unprecedented drop of around 8% in economic output in 2020, uncertainties over employment and strains to balance sheets and household finances are feeding through into constrained investment, despite government attempts to stimulate activity and limit the economic damage (see section 1.3.1). Against this backdrop, the near‐term shape of the economic recovery is closely tied to success in tackling the spread of the virus. However, the longer‐term outlook also depends on building out India’s physical and social infrastructure (a major focus for India’s stimulus spending), as well as on progress in tackling structural challenges affecting investment such as complicated permitting processes, tax arrangements and land acquisition processes.
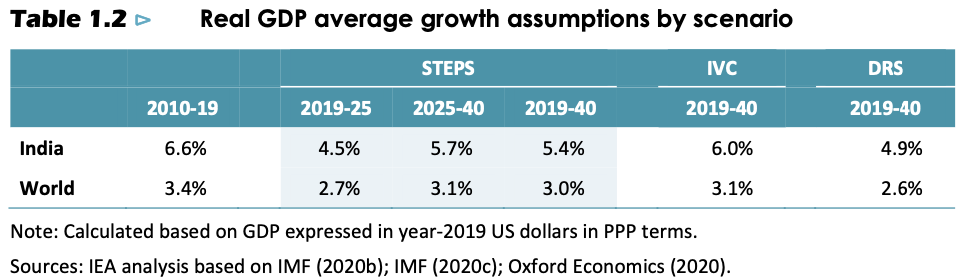
Our baseline assumption in the STEPS and in the SDS is that the pandemic is gradually brought under control in the course of 2021, allowing for a steady but far from V‐shaped recovery in economic activity. In these scenarios, the supply side effects of the pandemic are significant, but are limited by the relatively short duration of the crisis together with effective policy responses, and the trend rate for growth in Indian GDP post‐2022 moves back towards the level assumed before the crisis. The Indian economy is nonetheless smaller in 2040 than it was in the same scenarios in the WEO 2019.In the IVC, a swift and effective recovery from the effects of Covid‐19 is accompanied by a range of structural reforms that allow India to recover the lost ground in full and raise its long‐term growth potential. In this case, India becomes a $5 trillion economy before the end of the decade, somewhat later than targeted by the Indian government. Conversely, the DRS illustrates the risks arising from a prolonged pandemic. In this scenario, unemployment and fragile finances hit demand and investment across the entire economy, and rising debts limit the scope and effectiveness of government action.
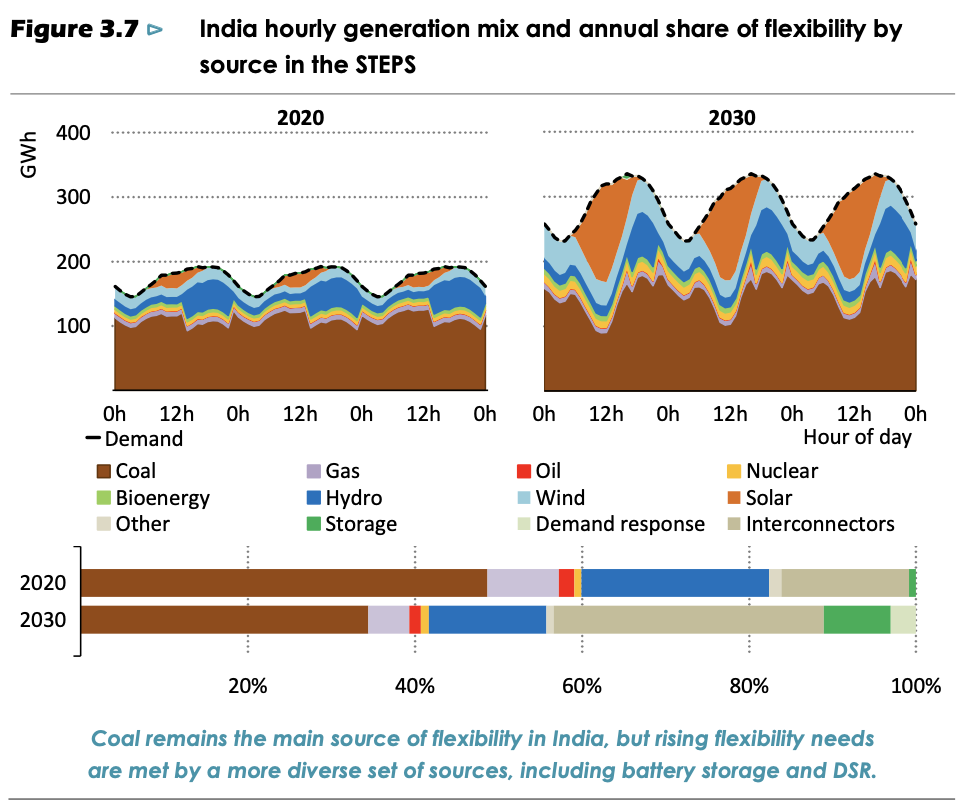
Battery storage systems and DSR also look set to be essential parts of the flexibility portfolio. Battery storage systems are well‐suited to the emerging need to shift solar PV output by several hours, from the middle of the day to evening peak demand, in order to better meet demand. By 2030, the STEPS sees nearly 35 GW of battery capacity. DSR, including the shifting of agricultural pumping and cooling loads, can likewise provide flexibility without compromising energy services to consumers by moving demand to times of the day with plentiful supply. Adapting regulation to permit the aggregation of loads could significantly expand DSR availability by enabling residential, agricultural, and smaller commercial and industrial customers to bring their DSR resources to a wide range of potential markets (IEA, 2018), especially since such smaller loads in buildings and agriculture represent the lion’s share of DSR potential in India. Tariff design could also facilitate DSR uptake among electricity users; switching to time‐of‐use pricing, or perhaps even real‐time pricing, would provide the necessary price signals to consumers to expand DSR from periodic load shedding in times of system stress to more regular load shifting (IEA, 2019).
Click to download

You must be logged in to post a comment.