
Over the last decade, the solar power sector has seen installation costs fall dramatically and global installed capacity rise massively. The International Renewable Energy Agency (IRENA) has reported that solar photovoltaic (PV) module prices have fallen 80% in the last decade, while installed capacity has grown from 40 GW to over 600 GW in the same period. These trends are set to continue with new global solar installations of over 140 GW expected in calendar year 2020.
The reason for this is straightforward. Solar radiation is essentially a free resource available anywhere on Earth, to a greater or lesser extent. Converting solar radiation into electricity is at present dominated by PV power plants, and in the current era of global climate change, PV technology becomes an oppor- tunity for countries and communities to transform or develop their energy infrastructure and step up their low-carbon energy transition.
But is the PV power potential in a specific country or region good enough to take advantage of solar power, and on what scale? This is a question often asked by policymakers and businesses alike, and one that this report attempts to shed further light on.
Recently, global data representing the solar resource and PV power output in every country of the world has been calculated by Solargis (Figure 3.4) and released in the form of consistent high-resolution data sets via the Global Solar Atlas, a web-based tool commissioned and funded by the Energy Sector Man- agement Assistance Program (ESMAP), a multi-donor trust fund administered by the World Bank [1]. Based on this data, it is possible to make high-level comparisons between countries and regions on their theoretical, practical, and economic solar potential.
This report provides such information to raise awareness, stimulate investment interest, and inform public debate. Therefore, it is relevant to policymakers, project developers, financial and academic sec- tors, and the media and communication professionals, as well as communities and individuals.
METHODOLOGY
There are numerous methodologies for evaluating solar energy potential in countries or regions. Chap- ter 2.1 provides a brief literature review by way of background and explains the methods applied in this study. Chapter 2.2 describes the global data sets that were collected and used in this report. As a gen- eral principle, the analysis relied on the best globally available and consistent data sets in each domain to ensure a high level of comparability of the results. Some data sets were ruled out, even if superior in granularity or quality, where just part of the global or individual countries were covered.
The long-term energy content of the solar resource available at a certain location defines the theoret- ical solar PV potential (Chapter 2.3). For PV technology, the energy content is well quantified by the physical variable of global horizontal irradiation (GHI). It is the sum of direct and diffuse irradiationomponents received by a horizontal surface, measured in kWh/m . GHI enables a comparison of the
conditions for PV technology without considering a specific power plant design and mode of operation. GHI is the first approximation of the PV power production in a particular region, but it disregards impor- tant additional factors.
The cornerstone of this report is therefore the evaluation of the practical solar PV potential (Chap- ter 2.4), which is the power output achievable by a typical PV system (PVOUT). Unlike the theoretical potential, it simulates the conversion of the available solar resource to electric power considering the impact of air temperature, terrain horizon, and albedo, as well as module tilt, configuration, shading, soiling, and other factors affecting the system performance. PVOUT is the amount of power generated per unit of installed PV capacity over the long term (the specific yield), measured in kilowatt hours per installed kilowatt peak (kWh/kWp).
The calculated practical potential can be considered as a conservative case—assuming a large-scale installation of monofacial crystalline silicon modules fixed mounted at an optimum angle, which has been the prevailing setup of PV power plants to date. This report evaluates the practical potential at three levels defined by a number of topographic and land-use constraints:
Level 0 disregards any limitations to the development and operation of solar projects.
Level 1 excludes land with physical or technical constraints. These include rugged terrain, extremeremoteness, built-up environment, and dense forests.
Level 2 additionally excludes land under ‘soft’ constraints, such as regulations related to protection of cropland and conservation areas.
Apart from the annual average of practical potential, the seasonal variability derived from the monthly PVOUT values is summarized and compared at the country level.The economic PV potential, expressed in this report via a simplified levelized cost of energy (LCOE), describes how much it would cost to produce a unit of energy. Apart from the PVOUT value, the cost of the PV technology, overall capital expenditure, operation costs, and discount rate are considered over the typical PV plant lifetime. The metric enables the comparison of solar energy to other energy gener- ation technologies (Chapter 2.5). The presented estimate illustrates the solar economic potential from a global viewpoint, with a country as the smallest unit serving as a basis for further in-depth analysis of local intricacies.KEY FINDINGS AND LESSONS LEARNEDThe geographical variability of the solar energy yield is primarily driven by the distribution of the solar resource. The global pattern of the resource (theoretical PV potential) is determined mainly by latitude, occurrence of clouds, terrain elevation and shading, atmospheric aerosol concentration, and atmo- spheric moisture content. At regional to local scales, solar resource is also affected by proximity to sea and large water bodies, as well as urban and industrial areas. This creates a very diverse spatial distri- bution of solar resource.Air temperature is the second most significant geographical factor, as it affects PV conversion effi- ciency. The power output is also variable in time: it changes over seasons and days due to astronomical
and geographical factors and, in the very short term, the variability is driven by clouds. Moreover, the practical utilization of solar power plants is limited by various physical and regulatory land-use constraints. Practical PV potential assessment provides a higher added value by including all these addi- tional factors.
Practical PV Potential Distribution
The results presented in this report show that the global range of PVOUT is not as wide as might be expected. The distribution of air temperature often counteracts the distribution of GHI (the theoretical potential). Places with below average solar radiation may benefit from cooler air temperatures year round, and conversely, high air temperatures may hinder the PV power output in regions with high solar resource.
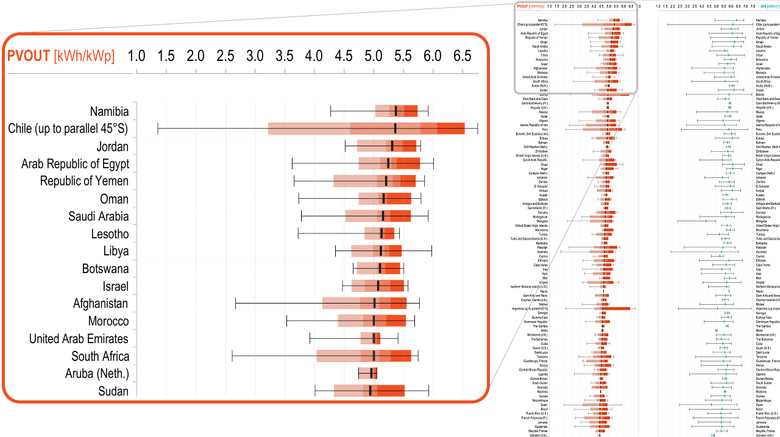
As a result, the difference between the countries with the highest (Namibia) and the lowest (Ireland) aver- age practical potential is only slightly higher than a factor of two. In total, 93% of the global population lives in countries where the average daily PV potential is in the range between 3.0 and 5.0 kWh/kWp.
Around 20% of the global population lives in 70 countries boasting excellent conditions for PV, where long-term daily PVOUT averages exceed 4.5 kWh/kWp. Countries in the Middle East and North Africa (MNA) region and Sub-Saharan Africa dominate this category, accompanied by Afghanistan, Argentina, Australia, Chile, Iran, Mexico, Mongolia, Pakistan, Peru, and many nations of the Pacific and Atlantic islands.
At the lower end of the ranking, 30 countries accounting for 9% of the global population score an average PVOUT below 3.5 kWh/kWp, dominated by European countries—except those in southern Europe—and also including Ecuador and Japan. Even in countries with lower solar resource availability, the potential is not dramatically lower compared to the top-performing group.
Finally, countries in the favorable middle range between 3.5 and 4.5 kWh/kWp account for 71% of the global population. These include five of the six most populous countries (China, India, the United States, Indonesia, and Brazil) and 100 others (Canada, the rest of Latin America, southern Europe, and African countries around the Gulf of Guinea, as well as central and southeast Asia).
Beyond Average Values
While knowing a single averaged value over the country’s territory is useful, the indicator may not be representative enough for countries with a diversified geography. Countries that are elongated in the north-south direction (i.e., have a significant latitudinal span), as well as those located within major mountain ranges or climatic gradients, tend to have a wide PV potential range.
Where possible, PV installations tend to be concentrated in areas with the most favorable solar resource conditions, and often a minor portion of a country’s area with feasible practical potential may host enough capacity to meet the country’s entire energy demand. Considering this, a higher percentile instead of the average (e.g., Percentile 75, Percentile 90, or the maximum) could better illustrate the potential for installation of large PV power plants in a country. Therefore, Figures 3.8 and 3.20 provide more detailed zonal statistics in individual country factsheets.
Executive Summary ix
Indeed, the availability of detailed PV power potential data enables an estimation of the country area that would be needed to cover electricity production targets. For instance, Mexico would need to dedi- cate only around 0.1% of its territory to utility-scale PV power plants to cover its entire yearly electric- ity consumption (about 270 TWh recently [2]). However, this percentage varies hugely by country. In France, due to higher electricity consumption and lower PV yield, it would be about 1.0% of the country area. In contrast, Ethiopia would need only 0.003% of its land area to be covered in solar PV to meet its annual energy needs in recent years.
PV Potential Seasonality
A single long-term yearly average of practical PV potential, summarized as PVOUT, does not tell the full story in the temporal domain, as it hides various profiles of seasonal variability. Stronger seasonal fluctuations pose economic and technological challenges to the exploitation of PV electricity. Therefore, this report includes new statistics describing the degree of seasonality at the country level (Figure 3.12).
Interestingly, there is a loose, indirect association between the PV potential and the seasonality index— defined as the ratio between the highest and the lowest monthly PVOUT. The high-potential countries tend to have low seasonality (below 2.0) and vice versa. In total, 86% of the global population lives in 150 countries where the average seasonality index is below 2.0, and PVOUT exceeds 3.5 kWh/kWp (the dense cluster of countries in the upper-left part of Figure 3.12). We suggest that it is these countries where solar PV is poised to meet a significant share of energy demand in the future.
In the remaining countries, despite higher seasonality and somewhat lower PVOUT values, solar PV may still be a profitable option playing an important role in the energy mix along with other energy sources. In many cases the seasonal variations of solar PV may be complementary to those of wind or other resources, and in countries with a high cooling demand solar PV can even be load following. While outside the scope of this report, the resources made available allow for such a high-level analysis to be carried out.
Economic PV Potential
Currently, data to accurately calculate the LCOE is available only for a fraction of the countries covered in this report. We derive a simplified version of LCOE as a proxy of the economic potential, taking gen- eralized assumptions about costs of construction and operation of a typical PV power plant. The value, conceived as a snapshot in 2018, ranged globally from under $0.06 to over $0.26 per kWh, with over 75% of the evaluated global area scoring below $0.12 (Figure 3.9).
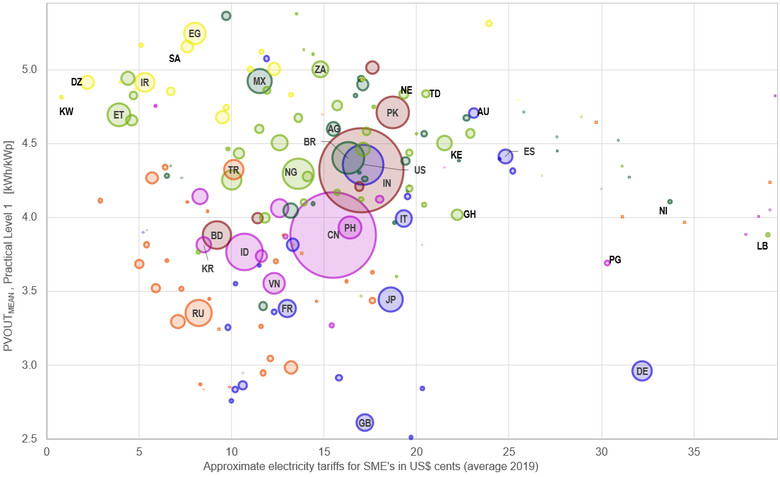
Comparing PVOUT with average electricity tariffs (Figure 3.18) shows why grid parity for solar PV is seen across a wide range of countries, regardless of their actual resource potential. The relative differences in electricity tariffs can far exceed the differences in practical and economic PV potential. Therefore, PV generation can be profitable in countries with some of the lowest average PV potential (such as Denmark, Japan, and the United Kingdom). Importantly, there is a group of countries with high tariffs (over $0.20) with high potential at the same time (over 4 kWh/kWp). This group includes many island nations and countries with less-developed electricity grids, where expensive and polluting small-scale diesel generators are the primary power generation source.
x Global Photovoltaic Power Potential by Country
A comparison of the PV potential with further socioeconomic indicators provides new insights. For example, a high number of less-developed countries—in terms of the Human Development Index, reli- ability of electricity supply, and access to electricity—tend to have very high practical PV potential, so far untapped (as illustrated by currently installed PV capacity, Figure 3.13). There is a unique opportu- nity for solar PV to provide affordable, reliable, and sustainable electricity services to a large share of humanity where improved economic opportunities and quality of life are most needed. The information and insights contained in this report can help to unlock some of that investment.
Explore More
The global data presented in this report, plus individual country factsheets, are available via the Global Solar Atlas at https://globalsolaratlas.info/global-pv-potential-study. Furthermore, the interactive tools, offered via the homepage of the Global Solar Atlas, make it possible to estimate the PV potential at a specific site or any defined region, and the site provides a wealth of additional data, maps, and reports.
Summary
Global data representing the solar resource and PV power potential has been calculated by Solargis, and released in the form of consistent high-resolution data layers.
To set the scene, we characterize the long-term energy availability of solar resource at any location, thetheoretical potential. This potential is illustrated by the physical variable of global horizontal irradiation (GHI), which is the sum of direct and diffuse irradiation components received by a horizontal surface. GHI is measured in kilowatthours per square metre (kWh/m2). The quantity allows comparing the natural conditions for implementation of any PV technology without considering a particular technical design and mode of operation. However, at a given site, GHI is modulated by local air temperature, wind and snow, atmospheric pollution, dust, and some other geographical factors. GHI is considered as a simplified approximation, and it does not fully describe the actual potential for PV power production.
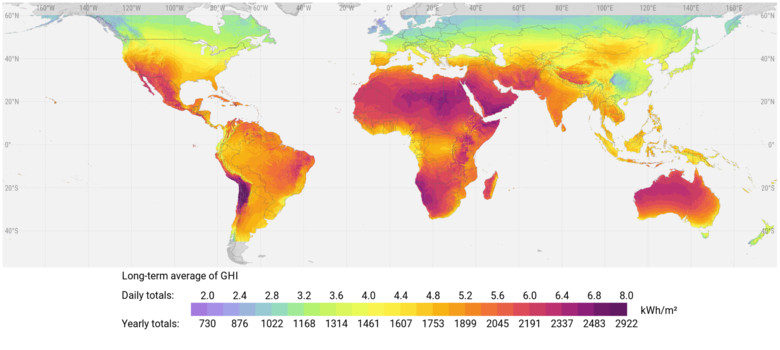
Global Horizontal Irradiation (GHI): Long-term yearly average of daily and yearly totals
The cornerstone of the study is the evaluation of the practical PV potential, i.e. the power output achievable by a typical configuration of the utility scale PV system, taking into account the theoretical potential, the air temperature affecting the system performance, the system configuration, shading and soiling, and topographic and land-use constraints. The PV power output (PVOUT), defined as the specific yield, is used to illustrate this potential. PVOUT represents the amount of power generated per unit of the installed PV capacity over the long-term, and it is measured in kilowatthours per installed kilowatt-peak of the system capacity (kWh/kWp).
This study describes three levels of practical potential. Level 0 disregards any limitations to the development and operation of solar power plants. To assess the potential more realistically, we exclude unsuitable land, with use of relevant global datasets. At Level 1, we exclude areas due to physical/technical constraints, such as rugged terrain, presence of urbanized/industrial areas, forests, and areas that are too distant from the centers of human activity. At Level 2, we additionally consider “soft” constraints, i.e., areas that might be unsuitable due to regulations imposed by national or regional authorities (such as conservation of cropland or nature conservation). Consequently, we evaluate and compare the spatial distribution of annual PVOUT values in countries and regions, and also explore the seasonal variability derived from the monthly PVOUT averaged values.
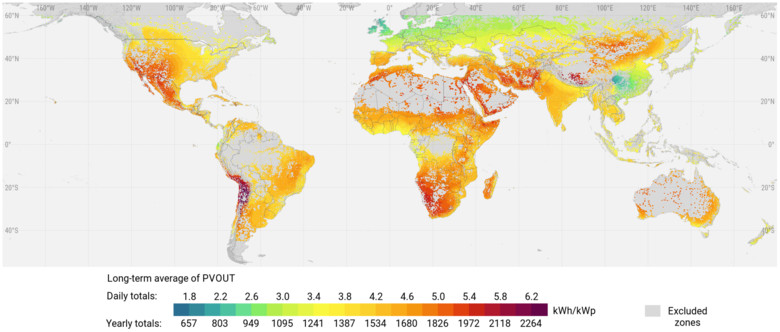
Practical photovoltaic power potential (PVOUT) at Level 1: Long-term yearly average of daily and yearly totals
A single long-term yearly average of PVOUT does not tell the full story as it hides various profiles of seasonal variability. Therefore, we present a seasonality index, a new statistics defined as the ratio between the highest and the lowest monthly totals. The high-potential countries tend to have low seasonality (below 2) and vice versa. In total, 86% of the global population lives in 150 countries where the average seasonality index is below 2.0, and PVOUT exceeds 3.5 kWh/kWp. The full monthly profiles and ranges are presented in the country factsheets.
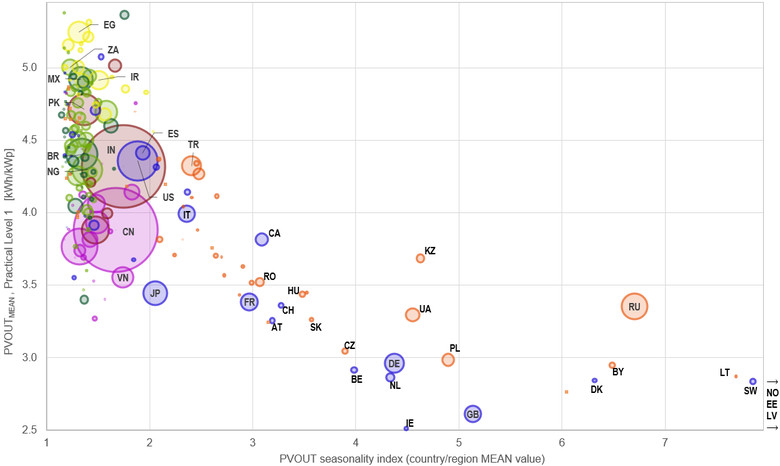
Absolute values of practical PV power potential (PVOUT) compared to PV seasonality index
We assess, also, the economic PV potential via the Levelized Cost of Energy (LCOE), a metric describing how much it costs to produce a unit of energy. LCOE enables comparison of solar energy to other energy generation technologies. This estimate takes a global viewpoint, with a country as the smallest unit, to illustrate the overall solar economic potential, which can be useful as a basis for further in-depth analysis of regional and local intricacies.
We proposed a simplified version of LCOE as a proxy to the economic potential, taking simplifying assumptions about costs of construction and operation of a typical large-scale ground-mounted PV power plant. The LCOE value, conceived as a snapshot in 2018, ranged globally from less than USD 0.06 to over USD 0.26 per kWh, with a significant part of the globe scoring below USD 0.12.
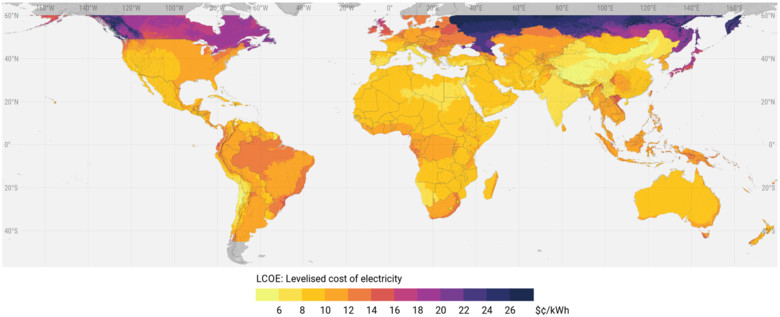
Levelized Cost of Electricity (LCOE) calculated for large scale ground-mounted PV power plants with the expected lifetime of 25 years
In addition to LCOE, we present a set of other socio-economic indicators to show the solar power generation potential in the context of economic, human, and social development.
While knowing a single averaged value over the country’s territory is useful, the indicator may not be representative enough for countries with a diversified geography. Therefore, we provide more detailed zonal statistics in the country factsheets prepared for individual countries. Where possible, PV installations tend to be concentrated in areas with the most favorable solar resource conditions, and often a minor portion of a country’s area with feasible practical potential may host enough capacity to meet the country’s entire energy demand. Given that, a higher percentile, instead of the average (e.g., 75% or maximum), could better illustrate the potential for installation of large PV power plants in a country.
The results show that the global range of practical PV potential (PVOUT) is, surprisingly, rather narrow. The distribution of air temperature (the second most important geographical factor, inversely affecting PVOUT) partially counteracts the distribution of theoretical potential by GHI (the main contributing factor). As a result, the difference between the countries with the highest (Namibia) and the lowest (Ireland) PV power potential is only slightly higher than a factor of two.
Thumbnail of the graph comparing the countries and regions (download the full size graph)
In total, 93% of the global population lives in countries where the average of daily PV potential is in the range between 3 and 5 kWh/kWp. Around 20% of the global population lives in 70 countries boasting excellent conditions for PV, where the long term PVOUT average exceeds 4.5 kWh/kWp per day. On the opposite side of the ranking, 30 countries (accounting only for 9% of the global population) score the average PVOUT below 3.5 kWh/kWp, dominated by the European countries (except for Southern Europe) but including also, countries such as Japan and Ecuador. Even in the countries with lower PV performance, the potential is not dramatically lower compared to the top-performing group. For instance, the average practical potential of Slovakia amounts to about two-thirds of Morocco’s average. Lastly, countries in the favorable mid-range between 3.5 and 4.5 kWh/kWp account for 71% of the global population. These include the five most populous countries (China, India, the United States, Indonesia and Brazil) and about 100 other countries.
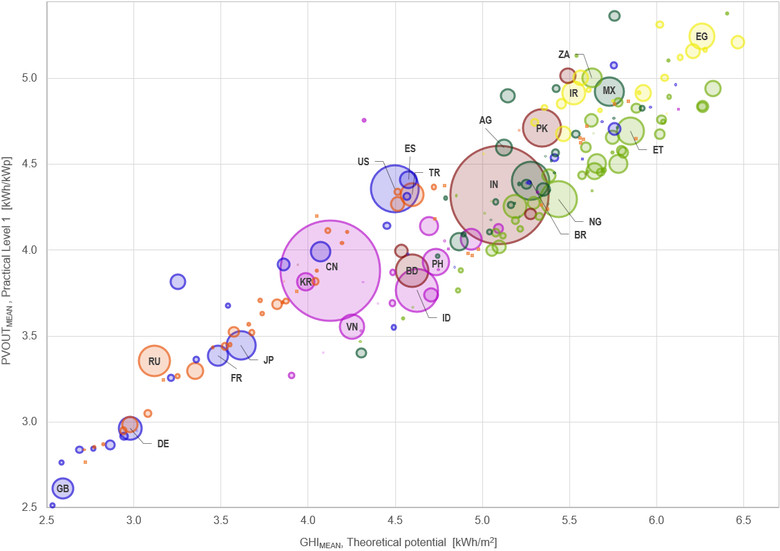
Average practical PV power potential at Level 1 (PVOUT) compared to theoretical potential (GHI).
Comparing PVOUT with average electricity tariffs reveals why grid parity for solar is seen across the countries, regardless of the actual potential. The relative differences in electricity tariffs can by far exceed the differences in practical PV potential (and LCOE). Therefore, PV generation can be profitable also in countries with some of the lowest PV potential (such as Denmark, UK, Germany and Japan). Importantly, there are several countries with high tariffs (over USD 0.20) that host high PV potential at the same time (over 4 kWh/kWp). This group includes many of the island nations and countries with less developed electricity grids, where expensive and polluting small-scale diesel generators are the primary power generation source today.
Practical PV power potential (PVOUT) vs. typical average electricity tariffs
A comparison of the practical potential with further socio-economic indicators provides new insights. For example, less developed countries (as per human development index, reliability of electricity supply, and rural access to electricity) tend to have very high practical PV potential, so far untapped. There is a unique opportunity of PV technology to provide affordable, reliable, and sustainable electricity services to a large share of humanity where improved economic opportunities and quality of life are the most needed.