Sign In Register Jobs & Tenders mihaaru.com Dho Magazine Flight Schedule The project is expected to save 15 million litres of imported diesel annually and reduce government expenditure by MVR 180 million a year, according to the ministry. Environment Minister Ali Shareef and China's Sinosaur Technology Country Manager Chao Shomin after signing the agreement — Photo: Environment Ministry Malika Shahid 2026-10-27 11:29:17 The government has signed agreements for a 15MW solar photovoltaic (PV) project across several islands, marking the largest solar PV agreement signed in the Maldives to date. The Ministry of Environment said the Power Purchase Agreement (PPA) and Implementation Agreement were signed under the Accelerating Renewable Energy Integration and Sustainable Energy (ERIS) project. The PPA between China’s Sinosoar Hybrid Technology and the State Electric Company (STELCO) was signed by Sinosoar Country Manager Cao Shomin and STELCO Managing Director Dr Ali Azwar.
The European Commission has launched T-MED with up to €4.5 billion in EU guarantees It will finance renewable energy and clean technology projects across the Mediterranean, and support related investments Initial projects include a €430 million hybrid solar PV project in Egypt and two 100 MW solar plants in Tunisia The European Commission has launched the T-MED Investment Platform, backed by up to €4.5 billion in European Union (EU) guarantees, to help finance renewable energy and clean technology projects across the Mediterranean. It aims to unlock the region’s renewable energy potential by supporting investments in renewables, electricity transmission, energy storage, distribution networks, cross-border interconnections, and clean-technology manufacturing. The platform will also address investment barriers related to permitting, grid access, regulatory frameworks, and power purchase agreements (PPAs). The T-MED Investment platform, short for Trans-Mediterranean Renewable Energy and Clean Tech Cooperation Initiative, is part of the EU’s broader package for the Mediterranean region, including the Middle East, North Africa, and the Gulf. It will facilitate cooperation between financial institutions, investors and project promoters. The idea is to match projects with potential financing sources and help turn investment opportunities into concrete projects. T-MED aims to boost local clean tech manufacturing and regional supply chains through industrial partnerships and joint procurement of solar PV, wind, storage, electrolyzer and grid technologies. “Our ambition is clear: to make clean energy a driver of shared prosperity, competitiveness and security across the Mediterranean and Europe,” said Dubravka Šuica, Commissioner for the Mediterranean. The EU unveiled T-MED in June 2026 to help mobilize €25 billion in public and private investment. At the time, the Commission announced it would support deploying 15 GW of new renewable energy capacity across the Mediterranean region by 2035 (see EU’s T-MED To Mobilize €25B For Renewable Energy & Clean Tech). In April 2026, it launched a call for expressions of interest for private investors. Some of the projects T-MED supports include modernizing and expanding the national electricity grid, with a total investment of €1.6 billion. It will integrate solar and wind power generated in the Red Sea and Gulf of Suez regions into the national grid. It has also enabled the construction of one of Africa’s largest hybrid solar PV projects in Egypt, worth around €430 million. In Tunisia, it is supporting the construction of two 100 MW solar PV plants and their associated transmission infrastructure with about €92 million and €80 million, respectively. The plan also involves training at least 100,000 technicians, engineers, installers, planners, and financial specialists by 2035. TaiyangNews 2024
Renewables Now is a leading business news source for renewable energy professionals globally. Trust us for comprehensive coverage of major deals, projects and industry trends. We’ve done this since 2009. Stay on top of sector news with with Renewables Now. Get access to extra articles and insights with our subscription plans and set up your own focused newsletters and alerts.
Solar Power World By Billy Ludt | Distributed Energy Infrastructure (DEI), an EPC firm for solar and battery storage, has completed the 3.37-MWDC Sapphire Solar project in Jefferson County, New York. The Sapphire Solar project. Credit: Distributed Energy Infrastructure Shallow bedrock and a high water table presented site challenges that required the team to adapt its design mid-construction. During excavation, DEI encountered shale bedrock only 16 to 20 in. below grade across several areas of the site, accompanied by groundwater continuously seeping into open trenches. The conditions impacted installation and equipment pad areas, making the original underground DC conduit design impractical to implement. DEI’s engineering, construction, procurement and contractor teams collaborated closely to quickly develop a revised design that converted a portion of the DC underground scope to an above-ground CAB system. Underground trenching was retained at row-to-row crossings and other locations where it remained appropriate. The revised design also preserved site access for the owner’s long-term operations and maintenance needs. The full redesign, material procurement and field implementation were completed within the timeframe originally planned for the underground trenching scope. “When we encounter unexpected challenges, our goal is to address them quickly and adapt our approach to what will work best for the site,” said Rusfid Haroon, senior project manager at DEI. “Even hitting shallow bedrock and water table across the site, we brought together the experience of each team working on the site to re-evaluate, re-design and implement a solution that kept the project moving while ensuring long-term reliability.” News item from Distributed Energy Infrastructure Billy Ludt is managing editor of Solar Power World and currently covers topics on mounting, inverters, installation and operations.
A drone photo taken on June 9, 2026 shows a wind farm and an energy storage power station in Ulanqab, north China’s Inner Mongolia Autonomous Region. By the end of September 2026, China’s cumulative installed capacity of wind and solar power reached 2.01 billion kilowatts, the country’s National Energy Administration announced on Monday. Of the total, solar power capacity stood at 1.31 billion kilowatts, up 16.5 percent year on year, while wind power capacity reached 700 million kilowatts, up 20.4 percent. (Xinhua/Lian Zhen) A drone photo taken on Oct. 27, 2026 shows an integrated fishery and photovoltaic project and a wind farm in Baoying County, east China’s Jiangsu Province. By the end of September 2026, China’s cumulative installed capacity of wind and solar power reached 2.01 billion kilowatts, the country’s National Energy Administration announced on Monday. Of the total, solar power capacity stood at 1.31 billion kilowatts, up 16.5 percent year on year, while wind power capacity reached 700 million kilowatts, up 20.4 percent. (Photo by Ren Fei/Xinhua) A drone photo taken on Oct. 21, 2026 shows a solar power base in Ningdong Town of Lingwu, northwest China’s Ningxia Hui Autonomous Region. By the end of September 2026, China’s cumulative installed capacity of wind and solar power reached 2.01 billion kilowatts, the country’s National Energy Administration announced on Monday. Of the total, solar power capacity stood at 1.31 billion kilowatts, up 16.5 percent year on year, while wind power capacity reached 700 million kilowatts, up 20.4 percent. (Photo by Yuan Hongyan/Xinhua) A drone photo taken on June 30, 2026 shows offshore and onshore wind farms in Pingtan, southeast China’s Fujian Province. By the end of September 2026, China’s cumulative installed capacity of wind and solar power reached 2.01 billion kilowatts, the country’s National Energy Administration announced on Monday. Of the total, solar power capacity stood at 1.31 billion kilowatts, up 16.5 percent year on year, while wind power capacity reached 700 million kilowatts, up 20.4 percent. (Xinhua/Lin Shanchuan) A drone photo taken on Sept. 9, 2026 shows an integrated fishery and photovoltaic project in Huanghua City, north China’s Hebei Province. By the end of September 2026, China’s cumulative installed capacity of wind and solar power reached 2.01 billion kilowatts, the country’s National Energy Administration announced on Monday. Of the total, solar power capacity stood at 1.31 billion kilowatts, up 16.5 percent year on year, while wind power capacity reached 700 million kilowatts, up 20.4 percent. (Xinhua/Yang Shiyao)
Renewables Now is a leading business news source for renewable energy professionals globally. Trust us for comprehensive coverage of major deals, projects and industry trends. We’ve done this since 2009. Stay on top of sector news with with Renewables Now. Get access to extra articles and insights with our subscription plans and set up your own focused newsletters and alerts.
Indian University Campus Could Cut Grid Power Use by Two-Thirds, Study Finds Shivaji University in Kolhapur, India, already runs 930 kilowatts of rooftop solar panels, but a new planning study argues that the campus could go much further. Researchers developed a framework called CMR-ESAF that models the university’s transition from a grid-dependent consumer to an optimized hybrid renewable energy system microgrid, and their simulation suggests grid electricity imports could fall by 67.8 percent compared with a grid-only baseline. The study, published in the journal Carbon Neutral Systems, is unusual among campus energy analyses because it does not start from a blank slate. Instead of treating the existing solar fleet as a hypothetical greenfield asset to be re-optimized, the authors treat the 930 kilowatt installation as a fixed baseline and ask a different question: how much additional benefit can storage, flexible demand, coordinated control, and extra renewables deliver beyond what the panels already provide? The framework separates three operating states, labeled S0, S1, and S2, so that planners can see the value already delivered and the incremental value of the next investment stage independently. State S0 is the reference case: a campus supplied entirely by the utility grid, with no renewables, storage, or demand management. Under the study’s annual hourly simulation assumptions, this baseline requires 3650 megawatt-hours of grid electricity per year, emits 2993 tonnes of carbon dioxide, and reaches a maximum demand of 1080 kilovolt-amperes. State S1 represents the campus as it exists today, with the 930 kilowatt rooftop photovoltaic system connected to the grid. In the simulation, this existing installation lowers grid imports to 2430 megawatt-hours per year, a 33.4 percent reduction in grid dependency, and avoids 1000.4 tonnes of carbon dioxide annually. Notably, the peak demand drops only modestly, from 1080 to 1000 kilovolt-amperes, because rooftop solar generation does not always coincide with the evening or non-solar periods when the campus billing peak occurs. State S2 is the proposed optimized configuration, and this is where the study’s central finding emerges. The selected design combines 1580 kilowatts of total photovoltaic capacity, meaning roughly 650 kilowatts of expansion beyond the existing fleet, with a 150 kilowatt wind generator, a 500 kilowatt and 1500 kilowatt-hour battery energy storage system, and 130 kilowatts of demand-side management participation, all coordinated by an energy management system. In the model, this combination reduces annual grid imports to 1175 megawatt-hours, cuts maximum demand to 695 kilovolt-amperes, achieves a 72.3 percent renewable fraction, and reaches 65.8 percent renewable self-sufficiency. The modeled annual utility cost falls from 413.6 lakh rupees to 145.7 lakh rupees, a saving of about 267.9 lakh rupees per year. The decomposition of energy savings is one of the study’s most decision-relevant results. The existing solar plant already saves 1220 megawatt-hours of grid electricity per year, but the optimized hybrid system delivers an additional 1255 megawatt-hours beyond that present-day condition. According to the authors, this additional saving cannot be achieved by expanding solar capacity alone; without storage, increased export and curtailment limit the benefit of extra panels. Battery storage absorbs surplus daytime generation and discharges during peak grid-import periods, while demand-side management shifts or reduces flexible loads such as pumping, schedulable heating and ventilation, and common-area services. Critical laboratories, safety systems, and information technology infrastructure are explicitly excluded from the controllable pool, and the 130 kilowatt figure is described as a planning envelope rather than a claim that all campus loads are interruptible. The optimization itself uses an adapted version of the NSGA-III evolutionary algorithm, modified for a many-objective, heavily constrained problem. Six independent objectives are minimized simultaneously: annualized campus cost, annual grid import, billing maximum demand, renewable curtailment, a self-sufficiency deficit, and a normalized network stress index combining transformer, feeder, and voltage utilization. Carbon emissions are deliberately excluded from the objective vector because, with a constant grid emission factor, they are exactly proportional to grid-import energy and would not add an independent optimization direction; instead, emissions are reported as a post-optimization indicator. The algorithm incorporates normalized constraint violation measures, a dynamic threshold that allows near-feasible boundary solutions to participate early in the search, angle-penalized reference-vector association, dual archives separating convergence and diversity, and a fuzzy membership rule to select a single best-compromise design from the final Pareto archive. A key architectural choice keeps the computation tractable. Rather than placing thousands of hourly dispatch decisions in the evolutionary chromosome, the optimizer handles only five continuous capacity variables: additional photovoltaic capacity, wind capacity, battery power and energy ratings, and the demand-side management limit. For every candidate capacity vector, a deterministic hourly energy management system evaluates all 8760 hours of the year using a fixed priority sequence, in which available renewables serve the post-management load first, surplus charges the battery, remaining surplus is exported up to the point-of-common-coupling limit or curtailed, and the battery discharges during tariff and peak windows before the grid covers the residual load. The campus network is represented as a reduced 45-bus planning model with six explicit distribution transformers, and voltage, feeder loading, transformer loading, and reverse-power-flow constraints are checked at every hourly point. The authors are careful to flag the limits of their evidence. The load profile was reconstructed chronologically to preserve measured annual energy and billing peak, because complete synchronized 8760-point measurements for every bus were not available; the solar series is a typical-year profile scaled to recorded yield, and the wind series is a planning-level profile rather than an on-site measured record. The 150 kilowatt wind unit is therefore conditional on a subsequent hub-height measurement campaign, and procurement would require at least a year of site-specific wind data, wake assessment, and manufacturer power-curve validation. The network layer is a screening model, not a protection-grade power-flow study, and hourly resolution cannot capture sub-hourly ramps or short-duration billing peaks. The battery degradation model is planning-level, triggering one module replacement in year 12 when usable capacity reaches 80 percent of nameplate, rather than an electrochemical aging model. The economics are calculated incrementally from the existing solar state to the optimized design, treating the 930 kilowatt plant as a sunk asset. The simple payback period is 6.4 years, and the levelized campus electricity cost, a metric the authors distinguish from a conventional generator LCOE because it includes residual grid purchases, is estimated at 4.85 rupees per kilowatt-hour against an assumed grid tariff of 10 rupees per kilowatt-hour. A discounted cash-flow analysis over 25 years, including the year-12 battery replacement, yields a net present value of approximately 4.32 crore rupees at an 8 percent discount rate and an internal rate of return near 14.1 percent. Sensitivity tests indicate the design remains viable under a 10 percent reduction in solar generation, which raises grid imports to 1305 megawatt-hours while keeping the renewable fraction above 65 percent, and under combined adverse cases involving load growth and higher battery costs. For the wider community of Indian higher-education institutions, many of which have large daytime loads, available rooftops, and high-tension supply connections, the study’s message is that stand-alone rooftop solar is only the first stage of a campus energy transition. The proposed pathway for Shivaji University involves retaining and monitoring the existing plant, expanding rooftop capacity, installing storage, implementing demand-side management within conservative limits, deploying coordinated dispatch, and considering voltage-support equipment such as a 300 kilovolt-ar D-STATCOM, which in a representative case raised the minimum bus voltage from 0.944 to 0.972 per unit. The authors emphasize that the reported values are simulation outputs under stated assumptions and that detailed site surveys, protection studies, and procurement-stage engineering must precede any implementation. Subject of Research: Techno-economic modeling of a hybrid renewable energy microgrid transition for an Indian university campus Article Title: From conventional campus grid to optimized HRES microgrid: a grid-constrained techno-economic and environmental assessment of renewable energy integration at Shivaji University, India Article References: Kamble, A. C., & Jadhav, H. T. (2026). From conventional campus grid to optimized HRES microgrid: a grid-constrained techno-economic and environmental assessment of renewable energy integration at Shivaji University, India. Carbon Neutral Systems, 2(1), Article 21. https://doi.org/10.1007/s44438-026-00041-3 Image Credits: AI Generated DOI:10.1007/s44438-026-00041-3 Keywords: microgrid, hybrid renewable energy, solar photovoltaics, battery storage, demand-side management, NSGA-III, campus energy, Shivaji University, grid constraints, peak demand, decarbonization, energy modeling News Source: Faith Mcneil. (October 28, 2026). Indian University Campus Could Cut Grid Power Use by Two-Thirds, Study Finds. Scienmag. We bring you the latest biotechnology news from best research centers and universities around the world. Check our website. Enter your email address to subscribe to this blog and receive notifications of new posts by email.
Home>ARENAWIRE>Revolutionising energy with Australia’s “solar superman” The majority of solar panels made today bear Professor Martin Green’s fingerprints. When Professor Martin Green started his solar research in the 1970s, the idea of using solar panels to power our homes was out of this world. NASA was developing solar technology to power spacecraft and satellites, but was far too expensive and inefficient for terrestrial applications. Half a century on, more than three million Australian homes have panels on their rooftops, combining into a force that is transforming the way we use energy. Professor Green joined us to share his remarkable story and look to the future of energy, now that solar has officially changed the game.
Looking back to his early days in the industry, Professor Green tells us that solar received a shot in the arm in the 1970s as the world searched for new sources of energy in the wake of the oil crisis. The US solar industry was fuelled by major investment under the Carter administration, but Professor Green took advantage of funding available locally to piece together a laboratory with largely second-hand equipment sourced from the US. Using his expertise in micro electronics, together with a team of talented technicians, they took aim at the world’s solar pioneers and almost immediately began claiming records. This helped to attract attention and funding, with the team’s competitiveness remaining a theme across the decades since. Professor Green’s Centre for Advanced Photovoltaics at the University of New South Wales has held world solar efficiency records for 30 of the last 38 years, with their designs used in the vast majority of solar panels produced around the world today. As well as helping solar to become the cheapest way of producing electricity in history (according to the International Energy Agency), Professor Green has blazed a trail for the next wave of renewable energy pioneers. His PhD student Dr Zhengrong Shi became the world’s first solar billionaire after setting up a solar manufacturing plant in China. Another student, Vince Allen, has gone on to shake up solar designs by using more abundant and affordable materials, already attracting heavyweight investors. As designs, materials and manufacturing techniques evolve to become more efficient and affordable, Professor Green doesn’t expect anything to change dramatically – at least for energy users. Paired with battery storage and pumped hydro, and used to make green hydrogen, he expects Australia to benefit from affordable, plentiful daytime energy before most other countries due to our world-leading solar uptake. He sees a role for this energy to power mineral processing and produce renewable fuels to decarbonise transport, highlighting a recent finding that the geographical diversity offered by Australia’s large landmass makes us particularly well-suited to renewable energy. He continues to be inspired by his team’s research and seeing the success of his students and is optimistic about the next wave of innovations. Subscribe to Rewired wherever you listen to podcasts to make sure you don’t miss an episode. ARENAWIRE is home to news, analysis and discussion about the projects ARENA funds. Join the discussion by following us on social or sign up to ARENAWIRE to receive our E-news.
False ceilings, fans and rooftop solar could cool Bangladesh’s rural clinics Rural community clinics in Bangladesh often rely on little more than electric fans to keep patients comfortable through a hot, humid season, while unreliable electricity supplies and rising energy prices make mechanical cooling hard to sustain. A new numerical study argues that a combination of three relatively simple rooftop interventions — a false ceiling with a ventilated air gap, scheduled mechanical ventilation, and rooftop solar panels — could cut the mean indoor temperature of such a clinic by nearly 5 °C and reduce its total annual energy consumption by more than a third compared with a building that has none of these features. The study, published in the journal Discover Energy, modelled the Rahimnogor Community Clinic in Khulna, Bangladesh, a single-storey government facility with a height of 3.5 metres that houses two rooms, two toilets and a patient waiting space. The researchers built a three-dimensional model of the building in DesignBuilder, using the EnergyPlus simulation engine to run a full annual simulation of 8,760 hours with local weather data. Heat conduction through the opaque envelope was calculated with the conduction transfer function method, and the model accounted for beam and diffuse solar radiation, surface reflections and shading cast by the rooftop photovoltaic array. Before applying the model to the clinic, the team validated it against a previously published DesignBuilder study of a building in a comparable hot and humid climate. The reproduced hourly indoor temperatures deviated from the reference data with a root-mean-square error of 0.9045 °C and a coefficient of variation of 2.52%, while annual energy consumption showed a coefficient of variation of 3.55%. The authors consider these deviations acceptable for whole-building energy simulation and treat them as evidence that the modelling approach can reliably capture both short-term thermal behaviour and long-term energy performance. The first strategy tested was purely passive: installing a gypsum plasterboard false ceiling beneath the roof, leaving an air gap between the two. Four gap thicknesses were examined — 0.15, 0.20, 0.30 and 0.40 metres. In free-running simulations with the HVAC system switched off, the mean indoor temperature fell by 2.4 °C, 2.54 °C, 2.71 °C and 2.9 °C respectively compared with the base case of no false ceiling. The air gap acts as a thermal buffer, and the larger the gap, the more air it contains and the more heat it intercepts before that heat can reach the occupied space below. The base case mean indoor temperature was 35.67 °C; with a 0.15 m gap it dropped to 33.26 °C, and with a 0.40 m gap to 32.77 °C. The second strategy added active ventilation to that buffer zone. An exhaust fan was modelled to draw ambient air through the gap and expel the heated air, operating on a fixed schedule from 8:00 a.m. to 5:00 p.m. at rates of 3, 4.5 or 6 air changes per hour (ACH). Rather than resolving the airflow field explicitly, the simulation prescribed these airflow rates, with the fan power included in the annual electricity tally. At the largest 0.40 m gap, mean indoor temperature reductions rose from 3.25 °C at 3 ACH to 3.59 °C at 4.5 ACH and 3.88 °C at 6 ACH. The mechanism is straightforward: faster air exchange removes accumulated heat from the roof cavity before it can conduct downward through the false ceiling. The energy results follow the same pattern but with an important caveat about diminishing returns. The base case consumed 8,479.89 kWh per year under a 25 °C cooling setpoint. A false ceiling alone cut this by 10.25% to 15.54% depending on gap size. Adding ventilation pushed the savings higher — at the 0.40 m gap with 6 ACH, total annual consumption fell to 6,331.82 kWh, a 25.33% reduction. However, the marginal benefit of each extra increment of airflow shrank: for the 0.15 m gap, moving from 0 to 3 ACH saved 5.39%, while the steps from 3 to 4.5 ACH and from 4.5 to 6 ACH added only 3.74% and 2.35% respectively. As the cavity air cools, less heat remains to be removed, so each additional unit of airflow yields progressively less. The third strategy mounted photovoltaic panels on the roof, tilted at 23° and facing south as appropriate for the northern hemisphere, with inter-row spacing calculated from a sun-path analysis for the worst-case shading date of late December. The panels work in two ways: they shade the roof surface, reducing solar heat gain into the building, and they generate on-site electricity that offsets part of the clinic’s demand. Because the shading effect already provides strong thermal protection, the authors found that enlarging the air gap beyond 0.30 m no longer justified the extra construction cost once panels were installed — going from 0.30 m to 0.40 m at 6 ACH bought only an additional 0.21 °C of mean temperature reduction. The best combined configuration — a 0.30 m air gap, 6 ACH mechanical ventilation and rooftop solar — reduced the mean indoor temperature by 4.68 °C relative to the base case, from 35.67 °C to 30.99 °C, with the panels contributing 1.01 °C beyond the ceiling-and-ventilation system alone. Peak indoor temperature on the simulated day fell from 37.98 °C in the base case to 32.35 °C. Total annual energy consumption dropped to 5,511.26 kWh, a 35.01% reduction. The rooftop array generated 958.93 kWh of electricity over the year, and the authors note this figure represents total generation, not electricity exported to the grid or a separate net balance after fan consumption. A thermal comfort assessment using the Predicted Mean Vote and Predicted Percentage Dissatisfied indices under ASHRAE Standard 55 reinforced the picture. In the base case, monthly PMV climbed from 0.45 in January to 2.69 in May, with the percentage of dissatisfied occupants rising from 12.2% to 83.6%. The integrated configuration kept PMV between 0.74 and 1.18 and PPD between 17.9% and 35.5% throughout the year — a substantial improvement, though discomfort still peaks in the warm months. An economic screen using a local tariff of BDT 7.93/kWh including VAT estimated a simple payback period of 6.14 years for the PV-assisted configuration, versus 7.82 years for the ceiling-and-ventilation system without panels. The authors are careful to frame these as simulation results for one representative clinic, with ventilation modelled through prescribed airflow rates rather than resolved airflow physics, and they recommend detailed cost-benefit analysis and testing across Bangladesh’s different climatic regions before the approach is generalised. Still, the message is that for the country’s more than 14,000 community clinics — facilities that mostly serve rural populations and often have fans as their only cooling — a layered strategy of roof-level shading, a ventilated ceiling cavity and on-site solar generation could deliver meaningful comfort and energy gains with comparatively modest, locally available components. Subject of Research: Simulation of passive and active roof cooling strategies with rooftop solar panels to improve thermal comfort and energy efficiency in a rural community clinic in Bangladesh. Article Title: Numerical analysis of passive and active cooling strategies with rooftop solar integration for indoor comfort and energy efficiency of community clinics in Bangladesh Article References: Muna, F. R., Fahim, G. S., Alam, M. M., Shahriar, K., & Ali, M. H. (2026). Numerical analysis of passive and active cooling strategies with rooftop solar integration for indoor comfort and energy efficiency of community clinics in Bangladesh. Discover Energy, 6(1), Article 95. https://doi.org/10.1007/s43937-026-00196-7 Image Credits: AI Generated DOI:10.1007/s43937-026-00196-7 Keywords: Bangladesh, community clinics, false ceiling, mechanical ventilation, rooftop solar panels, EnergyPlus, thermal comfort, energy efficiency, passive cooling, building simulation, air gap, photovoltaics News Source: Denise Maddox. (October 28, 2026). False ceilings, fans and rooftop solar could cool Bangladesh’s rural clinics. Scienmag. We bring you the latest biotechnology news from best research centers and universities around the world. Check our website. Enter your email address to subscribe to this blog and receive notifications of new posts by email.
Titanium Dioxide Microsphere Scattering Layer Boosts Dye-Sensitized Solar Cell Efficiency Researchers report that a top layer of hydrothermally synthesized titanium dioxide (TiO2) microspheres can act as an effective light-scattering layer in bilayer photoanodes for dye-sensitized solar cells (DSSCs), raising both photocurrent and overall power conversion efficiency compared with conventional single-layer electrodes. In the study, published as an open-access article in Scientific Reports, the microsphere layer redirects photons that the cell has not absorbed on the first pass back into the photoanode, giving the sensitizing dye a second chance to capture them. The bilayer design combines two structurally different TiO2 materials with complementary roles. The bottom layer uses commercial TiO2 nanoparticles (P25), which the authors describe as ensuring improved dye uptake and efficient electron transport, while the overlying microsphere layer serves as the light-scattering element. The team characterized the synthesized TiO2 microspheres before integrating them as the scattering layer and then evaluated complete cells sensitized with four ruthenium-based dyes: N3, N719, 520 DN, and Black dye. The measured performance gains were consistent across the dye series, with elevated short-circuit current density (Jsc) and overall power conversion efficiency (η) relative to single-layer reference electrodes. Incident photon-to-current conversion efficiency (IPCE) spectra agreed with the current-density improvements, supporting the interpretation that the microsphere scattering layer enhances light harvesting rather than producing an artifact. The best results came from the bilayer photoanode sensitized with N3 dye, which delivered a short-circuit current density of 4.308 mA/cm2, a power conversion efficiency of 1.59 percent, and a mean electron lifetime of 43.53 milliseconds. The electron-lifetime measurement is notable because DSSC performance is often limited by two linked problems: incomplete light harvesting and recombination losses, in which photogenerated electrons recombine before being collected. The authors frame the microsphere scattering layer as addressing the first of these, while the P25 underlayer addresses charge transport and dye loading. A longer mean electron lifetime in the N3-based bilayer cell suggests that recombination was not accelerated by the added layer, although the abstract does not report comparative lifetime values for the other dyes or for single-layer controls. DSSCs attract attention for both indoor and outdoor light-harvesting applications, and the authors state that the results demonstrate the potential of TiO2 microspheres to enhance light harvesting in these devices. They also suggest that the microsphere-based scattering approach may be explored for future transparent dye-sensitized solar cell (T-DSSC) applications, where managing how light passes through and within the photoanode is particularly important. The findings come from a single laboratory study of hydrothermally synthesized microspheres under the dye and cell configurations tested, so broader performance claims would require further validation. Within that scope, the work adds a comparatively simple structural strategy—layering a scattering layer of larger microspheres over a nanoparticle charge-transport layer—that measurably improved photocurrent and efficiency in the tested devices. Subject of Research: TiO2 microsphere scattering layers in bilayer photoanodes for dye-sensitized solar cells Article Title: TiO2 nanocrystalline microspheres as an effective scattering layer in bilayer photoanodes for DSSCs Article References: More, P. B., Mujawar, A., Salunke, S., Kim, J. M., Bulakhe, R. N., & Pathan, H. M. (2026). TiO2 nanocrystalline microspheres as an effective scattering layer in bilayer photoanodes for DSSCs. Scientific Reports. https://doi.org/10.1038/s41598-026-76770-9 Image Credits: AI Generated DOI:10.1038/s41598-026-76770-9 Keywords: TiO2, nanocrystalline, microspheres, effective, scattering, layer, bilayer, photoanodes, DSSCs, scientific research News Source: Denise Maddox. (October 26, 2026). Titanium Dioxide Microsphere Scattering Layer Boosts Dye-Sensitized Solar Cell Efficiency. Scienmag. We bring you the latest biotechnology news from best research centers and universities around the world. Check our website. Enter your email address to subscribe to this blog and receive notifications of new posts by email.
Emergency Backstory Newsletters 中文新闻 BERITA BAHASA INDONESIA TOK PISIN ABC Radio National Topic:Environment Could "night-time solar" energy be harnessed after sunset? (Getty Images: Dowell) It may sound like a contradiction in terms, but Australian researchers have made a major breakthrough in "night-time solar" technology. In what they claim is a world first, a team of researchers from the University of New South Wales (UNSW) has demonstrated that solar power can be generated at night. "In a sense, we've only been dealing with half of the opportunity, when we use photovoltaic solar cells to collect sunlight [during the day]," project leader Associate Professor Ned Ekins-Daukes tells ABC RN's Drive. Associate Professor Ned Ekins-Daukes says the technology is in its early days, but could have a big impact in the years ahead. (Supplied) So, what's behind this unlikely breakthrough? After the sun sets and the day darkens, Professor Ekins-Daukes says the potential for solar energy well and truly remains. "We get energy from the sun — it arrives, it warms up the Earth but then the Earth actually radiates the exact same amount of energy back out into space," he says. Professor Ekins-Daukes and his team contend that if the flow of this radiant heat could be tapped by a power cell device and converted into electricity, there's "a large and unused spectrum of potential power to be exploited." So, in a new study published in ACS Photonics, the team used a thermoradiative diode (a semiconductor sensor found in existing technologies like night-vision goggles) to capture photons leaving Earth along the infrared spectrum and converted them into electricity. How the new technology could be used in the years ahead. (Supplied: Idaho Design & Communication) "What you're doing is interrupting that flow of radiant heat, which is released every night out into the universe anyway, and tapping off a little bit of electricity from that," Professor Ekins-Daukes says. He says what's "really exciting" is the technology "allows us to generate electricity at night, just from the cold night sky." Australia is one of the world's biggest adopters of rooftop solar. Since 2001, the number of customers with solar panels has ballooned to more than 3 million. And in 2021, there was a record uptake of more than 3,000MW of rooftop solar installed by Australian householders. Professor Ekins-Daukes stresses this new "night-time solar" technology is still very much in its early days. "We've just demonstrated that this is possible … Right now, the device we've made is relatively low power. [But] this is to be expected when you're at the very early stages," he says. The amount of energy produced was only extremely small — roughly equivalent to 1/100,000th of a solar powered cell. A very small diode with very big potential. (Supplied: The University of New South Wales) But the team argues that it is the "proof of concept that is big." "The question here for the thermoradiative diode is how can we get from this scientific demonstration, through to scaling the manufacturing to a level where we could get the cost down. And that really depends on how engaged industry can be," Professor Ekins-Daukes says. "It will take some time … And I have to be honest, we need to find some new materials to achieve [widespread use]." But he says, in the future it may be possible to combine photovoltaic devices, or the solar panels widely in use today, and the thermoradiative diode for "night-time solar" power. "You could have a panel that generates power during the day, but then could also power the other items that are still running in your house at night." Get more stories that go beyond the news cycle with our weekly newsletter. See more ABC coverage in your search results Topic:Inflation LIVE Topic:Gambling Topic:Welfare Topic:One Nation Topic:History Topic:Solar Energy Topic:Climate Change Topic:Environment Energy Research Environment Science and Technology Solar Energy Sydney Topic:Inflation LIVE Topic:Gambling Topic:Welfare Topic:One Nation Topic:Television Topic:Parenting Topic:Climate Change Topic:Disaster and Emergency Response Your home of Australian stories, conversations and events that shape our nation. This service may include material from Agence France-Presse (AFP), APTN, Reuters, AAP, CNN and the BBC World Service which is copyright and cannot be reproduced. Get the latest ABC News delivered to your email inbox Stay informed and connected with the ABC. Covering a wide range of topics and brands including News, iview, listen, and more.
Renewables Now is a leading business news source for renewable energy professionals globally. Trust us for comprehensive coverage of major deals, projects and industry trends. We’ve done this since 2009. Stay on top of sector news with with Renewables Now. Get access to extra articles and insights with our subscription plans and set up your own focused newsletters and alerts.
We use some essential cookies to make this website work. We’d like to set additional cookies to understand how you use GOV.UK, remember your settings and improve government services. We also use cookies set by other sites to help us deliver content from their services. You have accepted additional cookies. You can change your cookie settings at any time. You have rejected additional cookies. You can change your cookie settings at any time. Departments, agencies and public bodies News stories, speeches, letters and notices Detailed guidance, regulations and rules Reports, analysis and official statistics Consultations and strategy Data, Freedom of Information releases and corporate reports The Frodsham Solar DCO application has today been granted development consent by the Department for Energy Security and Net Zero. Developer's illustration of Frodsham Solar The application is for a Solar photovoltaic array with an electrical generating capacity of over 50MW comprising solar PV modules and related mounting structures, inverters, transformers, switch gear and control equipment, a substation, and underground on and off-site cabling, as well as associated energy storage equipment. The application was submitted to the Planning Inspectorate for consideration by Frodsham Solar Ltd on 30 May 2025 and accepted for examination on 27 June 2025. Following an examination during which the public, statutory consultees and interested parties were given the opportunity to give evidence to the Examining Authority, recommendations were made to the Secretary of State on 29 July 2026. This is the 116th energy application out of 184 applications examined to date and was again completed by the Planning Inspectorate within the statutory timescale laid down in the Planning Act 2008. Local communities continue to be given the opportunity of being involved in the examination of projects that may affect them. Local people, the local authority and other interested parties were able to participate in this six-month examination. The Examining Authority listened and gave full consideration to all local views and the evidence gathered during the examination before making its recommendation to the Secretary of State. The decision, the recommendation made by the Examining Authority to the Secretary of State for Energy Security and Net Zero and the evidence considered by the Examining Authority in reaching its recommendation are publicly available on the project pages of the National Infrastructure Planning website. This decision was made by Baroness Curran on behalf of the Energy Secretary’s legal authority. Journalists wanting further information should contact the Planning Inspectorate Press Office, on 0303 444 5004 or 0303 444 5005 or email: Press.office@planninginspectorate.gov.uk The following links open in a new tab Do not include personal or financial information like your National Insurance number or credit card details. To help us improve GOV.UK, we’d like to know more about your visit today. Please fill in this survey (opens in a new tab).
Raising the operating voltage of solar photovoltaic systems can reduce balance of system costs and improve the levelised cost of energy, but new research shows it also increases the risk of severe module degradation. A new study titled ‘Degradation of photovoltaic modules at medium voltage with different types of encapsulants,’ examined potential induced degradation, or PID, in PERC photovoltaic modules at negative 1500 V, negative 3000 V and negative 6000 V for 96 hours. The negative 6000 V test is reported as the highest voltage examined in published literature. The researchers found that degradation increased with the absolute value of the applied voltage. This was linked to changes in the electrical conductivity of module encapsulants under high electric fields. At medium voltage, polymer encapsulants may no longer behave according to Ohm’s law, with charge traps filling and allowing current to rise more rapidly as voltage increases. Higher system voltages are attracting interest because they can reduce cabling and inverter costs. The study notes that moving from 1500 VDC to 3000 VDC could cut copper and aluminium consumption by 47% and reduce DC voltage drop power losses by 50% for a 2.5 MVA power plant. Trina Solar has also indicated overall capital expenditure savings of US$2.3 million for a 100 MWAC plant using 2000 V modules and inverters rather than 1500 VDC equipment. The research tested four encapsulant materials at negative 3000 V: EVA, TPO, POE and ionomer. Modules using POE showed the lowest current voltage losses, confirming its value as a low conductivity barrier against PID. EVA and TPO showed higher degradation, likely because their lower threshold voltages allowed conductivity to increase more sharply under electrical stress. Ionomer, although a strong insulator at low voltage, also recorded substantial degradation. The study found a strong correlation between maximum power loss and encapsulant conductivity on both the front and rear sides of PERC cells. Rear side losses were more strongly linked to conductivity, consistent with PID-p mechanisms involving electronic conductivity, while front side losses were associated mainly with PID-s and ionic conductivity. A further finding was the first reported evidence of partial discharge degradation in photovoltaic modules, termed PID-d. This phenomenon occurred at the cell ribbon and produced electrical trees within the modules. The researchers warn that partial discharges must be avoided because they can lead to dielectric breakdown and say both encapsulant properties and module design will be important mitigation tools. Modules exposed to negative 6000 V showed limited recovery after 20 hours of illumination at one sun intensity, indicating that severe PID damage at medium voltage may be difficult to reverse. The authors conclude that the transition to medium voltage solar modules carries material risks, but that laboratory testing and careful encapsulant qualification can identify and quantify these risks before deployment. They recommend measuring encapsulant conductivity under realistic temperature, humidity and electric field conditions rather than relying only on low voltage measurements. Link to the full paper HERE Author: Bryan Groenendaal
The smoke can significantly reduce the amount of electricity generated by solar farms, even when the fires are burning many kilometres away. UNSW Sydney researchers said better forecasting of smoke movements, more frequent panel inspections and cleaning, and changes to how solar panels operate could help solar farm operators prepare for these events and protect their equipment. The recommendations follow a study examining the effects of two major Australian bushfires – the 2019-2020 Black Summer fires and Victoria’s 2009 Black Saturday fires. Using historical weather and satellite data, the researchers modelled how smoke and airborne particles affected solar electricity generation and panel temperatures across south-eastern Australia. The UNSW’s School of Photovoltaic and Renewable Energy Engineering published the findings. Author Dr Shukla Poddar said the findings highlight the need to look beyond solar farms immediately surrounding a fire and consider where smoke is likely to travel. “We should start looking into things like trajectory modelling of the smoke and how long and far those smoke particles can be transported,” she said. “Extreme bushfires are becoming more frequent and intense in several regions, including Australia, California and southern Europe. Their impacts are not confined to the areas where fires burn: smoke from California’s 2020 wildfires reached Europe, while smoke from Spain’s 2025 fires travelled as far as the UK and northwestern Europe. “Although this particular study is based on two extreme bushfires in Australia, the same method and analysis can be done for other parts of the world.” Solar panels generate electricity by converting sunlight into electrical energy. Smoke and airborne particles can reduce the sunlight reaching the panels, lowering the amount of electricity they produce. The UNSW study found that the impacts can extend well beyond the immediate fire zone. During the Black Summer bushfires, the researchers estimated that electricity generation fell by as much as 70% at locations within about 50 kilometres of fire hotspots during several consecutive days. In regions more than 150 kilometres from hotspots, the study estimated there were still losses of up to 30%. The effects varied with the severity of the fires and the weather. During the 2009 Black Saturday bushfires, the study estimated lower reductions of generated power of around 18% near fire hotspots and up to 10% in more distant regions. These figures are modelled estimates rather than measurements from individual solar farms. The researchers were unable to separate smoke-related losses from other factors, such as electricity generation being deliberately limited when the grid did not need all the power available. Smoke distribution Researchers recommend combining bushfire information, wind patterns and smoke-trajectory modelling to help predict which solar farms are likely to be affected. Weather forecasts already help operators anticipate conditions such as high temperatures and strong winds. A similar system for smoke could give them advance warning that airborne particles are heading towards their facilities. That warning could allow operators to plan inspections, schedule cleaning or adjust the position of panels before smoke arrives. The study also highlights the importance of panel maintenance, particularly during bushfire periods. Smoke particles can settle on solar panels, reducing the sunlight reaching their surfaces. If deposits accumulate unevenly, they may also create localised hot spots, where parts of a panel become much hotter than others. Over time, these hot spots can damage cells and reduce their performance. The study did not model this localised damage directly, so further work is needed to establish how frequently it occurs during bushfires and how much generation it can cost. Poddar recommends more frequent cleaning when smoke is likely to affect a solar farm, alongside regular thermal inspections to identify unusually hot panels or electrical components. The paper also recommends better remote monitoring and electrical fault detection, allowing operators to identify temperature anomalies and quickly isolate affected parts of a system. Managing grass and shrubs beneath panels, maintaining firebreaks and preparing bushfire management plans can help reduce the risk of fires starting or spreading within solar farms. Many large solar farms use tracking systems that move panels to follow the Sun throughout the day. Poddar advised operators temporarily adjust those angles during particularly hot periods, such as when bushfires are occurring, rather than always positioning panels for maximum sunlight. “The aim would be to reduce heat exposure and potentially help loose particles move off panel surfaces. Such adjustments would involve a trade-off since panels may produce less electricity while turned slightly away from the Sun,” she said. The research findings could also inform decisions about where to build future solar farms. Developers could assess the history of nearby bushfires and examine prevailing wind directions and likely smoke pathways before investing in a site. Newsletter Signup Sign-up to receive weekly updates and the latest HVACR news in our email newsletter. Subscribe CCN is Australia’s only independent publication servicing the HVACR sector and climate control industry. Learn Connect We acknowledge the Traditional Custodians of country throughout Australia and their connections to land, sea and community. We pay our respect to Elders past and present and extend that respect to all Aboriginal and Torres Strait Islander peoples.
IoT Sensors and Hybrid Machine Learning Model Predict Solar Panel Faults Before They Strike Solar photovoltaic systems have become one of the fastest-growing renewable energy technologies, deployed everywhere from utility-scale plants to residential rooftops. Yet their long-term performance is constantly threatened by environmental variability, component deterioration, power-electronic failures and aging effects. A new open-access study published in Discover Electronics on 26 October 2026 proposes a framework that combines low-cost Internet of Things hardware with machine learning to detect developing faults in solar panels before they force a system offline. The research, authored by Aditi Chatterjee and Nabadeep Patra, addresses a well-known weakness of conventional photovoltaic maintenance. Routine manual inspections are time-consuming, labor-intensive and poorly suited to large or distributed solar farms, and they often fail to catch early-stage problems such as hotspots, soiling, wiring flaws and module degradation. Corrective maintenance, which acts only after a fault appears, adds further downtime and emergency repair costs, while human diagnostic judgments can be subjective and inconsistent. At the heart of the work is a hardware prototype for real-time solar data acquisition. Sensors deployed at the panel measure output voltage, output current and panel surface temperature, with a battery-side voltage sensor tracking terminal voltage to estimate state of charge and state of health, and a third voltage sensor monitoring the load side. A solar charge controller regulates charging, prevents overcharging, blocks reverse current flow at night and protects the battery bank, which operates at 12 volts DC. A buck converter steps this down to the regulated 5 volts required by an ESP32 microcontroller, its sensors and the communication module, while an automatic cut-off circuit guards the battery against deep discharge and overload. Data leaves the transmitter station over LoRa, a long-range wireless technology that the authors note can transfer data across distances of 2 to 5 kilometers or more while consuming very little power. A second LoRa module at the remote monitoring station receives the packets and passes them to a receiver-side ESP32, which forwards the collected data through a Wi-Fi or internet connection to a cloud server. The team used the Blynk console cloud platform, whose dashboard can be viewed in real time from any internet-connected smartphone, laptop or desktop computer. On the software side, the researchers assembled a training dataset of roughly 20 features, including temperature, irradiance, humidity, panel age, maintenance count, soiling ratio, voltage, current, module temperature, cloud coverage, wind speed, pressure, efficiency, derived interaction terms such as irradiance squared and an irradiance-temperature interaction, string identifiers and installation type. Raw data from photovoltaic panels and open-source repositories frequently contain noise, missing values and inconsistent measurements, so the team cleaned the data and scaled numeric features using min-max normalization and Z-score standardization to prevent variables of different magnitudes from biasing model training. Four machine learning models were then implemented for the predictive maintenance task: linear regression, decision tree, random forest and XGBoost. The decision tree splits data at decision nodes using an information gain criterion but risks overfitting; the random forest averages many randomly generated trees to improve precision on large datasets; and XGBoost builds decision trees sequentially, correcting each tree’s errors, with built-in L1 and L2 regularization that makes it more resilient to overfitting than standard gradient boosting. The study’s central contribution is a hybrid model that applies Bayesian optimization to XGBoost, using the Optuna framework for automatic hyperparameter tuning. XGBoost is highly sensitive to parameters such as learning rate, maximum tree depth, subsample ratio and number of estimators, and traditional tuning by grid search or random search can be computationally expensive and suboptimal. Bayesian optimization instead builds a probabilistic surrogate model of the objective function and uses an acquisition function to decide where to sample next, balancing exploration and exploitation. It converges to good settings faster than exhaustive search, and by optimizing regularization terms it helps the model avoid fitting sensor noise, which the authors argue supports better generalization to unseen test data in real-time monitoring. In comparative simulations run in Python, the hybrid Bayesian-optimized XGBoost model outperformed the other models, achieving the highest R2 score of 0.98, indicating the highest accuracy among the tested models, along with minimized error values measured as root mean square error, mean absolute error and mean square error. It was also the fastest: the hybrid model computed in 0.32543 seconds, compared with 0.43479 seconds for the standard XGBoost model. The authors attribute this speed advantage to Bayesian optimization’s targeted search of the hyperparameter space rather than brute-force exploration of irrelevant combinations. The researchers frame the combined system as a shift from reactive to predictive maintenance. In their analysis, reactive maintenance kicks in only after a significant drop in solar efficiency, producing long diagnostic and repair downtimes, energy lost during fault periods and costly emergency interventions. A predictive approach, by contrast, continuously monitors sensor data with machine learning models, detects anomalies early and schedules repairs before failure occurs, keeping assets running at their best condition. Once validated, the model’s predictions allow early detection of potential photovoltaic faults, and any detected anomaly is flagged on the dashboard or through an alert message. The authors conclude that data-driven, IoT-enabled techniques are a promising option for predictive maintenance of solar panels compared with conventional operation and maintenance methods. The findings come with the usual caveats of an early-stage engineering study: the machine learning comparison was performed in simulation on the assembled dataset, and the hardware prototype demonstrates data acquisition, transmission and cloud monitoring rather than long-term field-deployed fault prediction. The datasets generated and analysed in the study are available from the corresponding author on reasonable request. Even so, the work illustrates how inexpensive sensors, low-power long-range radio and tuned ensemble learning could together form the backbone of smarter solar farm upkeep. Subject of Research: Predictive maintenance of solar photovoltaic panels using IoT-based real-time monitoring and hybrid machine learning models Article Title: Prognostic maintenance and smart monitoring of solar panel using IoT devices and hybrid machine learning models Article References: Chatterjee, A., & Patra, N. (2026). Prognostic maintenance and smart monitoring of solar panel using IoT devices and hybrid machine learning models. Discover Electronics, 3(1), Article 152. https://doi.org/10.1007/s44291-026-00306-8 Image Credits: AI Generated DOI:10.1007/s44291-026-00306-8 Keywords: solar photovoltaics, predictive maintenance, Internet of Things, machine learning, XGBoost, Bayesian optimization, LoRa, ESP32, fault detection, renewable energy, cloud monitoring, sensor data News Source: Teresa Odom. (October 27, 2026). IoT Sensors and Hybrid Machine Learning Model Predict Solar Panel Faults Before They Strike. Scienmag. We bring you the latest biotechnology news from best research centers and universities around the world. Check our website. Enter your email address to subscribe to this blog and receive notifications of new posts by email.
Credit: AFP Japan plans to provide about JPY100 billion (US$634.1 million) over four years to support mass production of next-generation perovskite solar cells, seeking to establish a domestic manufacturing base before China further widens its lead in the emerging… Keep me signed in Some subscribers prefer to save their log-in information so they do not have to enter their User ID and Password each time they visit the site. To activate this function, check the ‘Keep me signed in’ box in the log-in section. This will save the password on the computer you’re using to access the site.
Enter to search English articles · Esc to close · ↑↓ to move Translated from the Japanese original Perovskite solar cells are a promising next-generation technology, but they have long faced a trade-off between power conversion efficiency and durability. One cause is “spiro-OMeTAD,” an organic semiconductor widely used in the hole transport layer. The material is important for achieving high power conversion efficiency (PCE), but the lithium salts and volatile additives mixed in to raise its conductivity have contributed to device degradation from heat and moisture. Using fewer additives could improve durability, but until now that meant insufficient conductivity and lower efficiency. To address this, a joint research team led by Dr. SeJin Ahn of the Korea Institute of Energy Research (KIER) and Dr. Dong Suk Kim of the Ulsan National Institute of Science and Technology (UNIST) developed a new manufacturing process that combines a catalytic reaction with filtration. The findings were published online in Advanced Science on January 26, 2026. In the new process, fine nickel oxide (NiOₓ) particles speed up the oxidation of spiro-OMeTAD while also capturing lithium ions on their surfaces, and filtration then removes them from the solution. Perovskite solar cells made this way retained 95% of their initial conversion efficiency after 1,000 hours in a hot, humid environment of 85°C and 85% relative humidity. However, this result was obtained under specific laboratory conditions and does not directly prove the long-term service life of commercial solar panels. What stands out about this result is not simply that the devices survived a 1,000-hour durability test. It is that the team removed components that cause degradation before the film is formed, without using the additives that have conventionally been considered necessary for high efficiency. Understanding the technical significance requires looking at both the test conditions and the chemical reactions in the hole transport layer. AD The team’s finding of “95% of initial efficiency after 1,000 hours” does not mean the cells convert 95% of sunlight into electricity. It is the “normalized efficiency retention”: taking the conversion efficiency at the start of the test as 100%, performance equivalent to 95% of that remained after 1,000 hours. And while 1,000 hours is roughly 42 days, that alone cannot establish that the cells would last 20 to 30 years on a home rooftop. The absolute conversion efficiency values at the start and end of the damp-heat test are also not stated in the published materials we could confirm. The team fabricated small, lab-scale n-i-p perovskite solar cells. To evaluate durability, they used damp-heat conditions of 85°C and 85% relative humidity, which are also used in international reliability testing of solar cells. Encapsulated devices were placed in a dark, hot, humid environment to examine how heat and moisture affect performance. This test evaluates moisture ingress and heat-driven material degradation; it differs from conditions in which a cell keeps generating power under sunlight. Separately, the team ran a maximum power point tracking (MPPT) test, in which simulated sunlight is applied continuously and power is actually drawn from the device while performance changes are monitored. The illumination condition was 1 sun, meaning continuous light at the standard intensity of 1,000 watts per square meter. In this continuous operation test, devices made with the new process also retained more than 90% of their initial conversion efficiency after 500 hours. By contrast, the comparison devices in the paper showed significant performance loss over the same period. Good results in both the dark damp-heat storage test and the continuous operation test under illumination are meaningful. However, the two tests were run under different conditions, so the 95% retention figure cannot be interpreted as durability during continuous power generation. Outdoors, heat, moisture, light, and electrical load act simultaneously, so there are also limits to predicting real-world lifespan from either test result alone. In perovskite solar cells, the hole transport layer (HTL), which carries holes (positively charged carriers) generated in the light-absorbing layer to the electrode, plays a key role in determining efficiency. The organic semiconductor widely used for this layer is spiro-OMeTAD. On its own, however, spiro-OMeTAD has low electrical conductivity, so it is generally p-doped through oxidation to improve hole transport. In the typical conventional recipe, lithium bis(trifluoromethanesulfonyl)imide (LiTFSI) is added as a dopant, along with 4-tert-butylpyridine (tBP). The tBP helps dissolve the LiTFSI and promotes uniform doping. But tBP is volatile, and in high-temperature environments it can change the composition and microstructure of the film, potentially leading to voids and defects. Meanwhile, lithium ions (Li⁺) from LiTFSI are small and mobile, so heat and electrical stress can drive them to diffuse through the device and accumulate at interfaces, triggering degradation reactions. Such ion migration and the formation of byproducts reduce the conductivity of the hole transport layer and impede charge transport. To tackle this problem, the team devised a method that carries out the oxidation needed for doping in solution before film formation, removing degradation-causing components before the film is made. At its core is micrometer-sized nickel oxide (NiOₓ) powder. NiOₓ not only promotes the oxidation reaction but also captures lithium ions on its surface. The new process proceeds as follows: A distinctive feature of this method is that NiOₓ does not remain as a component of the finished solar cell. Some solar cells use NiOₓ as the hole transport layer itself, but in this study it serves as a redox catalyst and lithium adsorbent that treats the solution before film formation. Once the NiOₓ particles have completed the necessary reactions, they are filtered out along with the captured lithium ions. In other words, the catalyst is used midway through manufacturing and never carried into the final film. The team evaluated the lithium removal using time-of-flight secondary ion mass spectrometry (ToF-SIMS). The results showed that lithium-derived signals dropped substantially in films made with the new process, indicating that residual lithium inside the device was greatly reduced compared with conventional processing. However, a large drop in the detected signal does not mean residual lithium has fallen to zero. The long-term effects of trace residues will need continued evaluation. AD If improved durability came with a major loss of efficiency, the practical benefit would be limited. But the maximum power conversion efficiency (PCE) of perovskite solar cells made with the new process reached 25.24%. A comparison device made with the conventional additive recipe using LiTFSI, tBP, and other components reached a maximum of 25.21%, so the two performed at nearly the same level. The difference is only 0.03 percentage points, so it would not be appropriate to conclude that power generation performance itself improved significantly. Solar cell efficiency measurements vary with factors such as the light source spectrum, measurement area, voltage scan conditions, and hysteresis (the phenomenon in which measured values differ depending on the direction of the voltage sweep). A slight difference in peak values therefore cannot establish which device performs better. The value of this result is that efficiency comparable to conventional devices was secured without volatile additives and with substantially less lithium. Lithium removal is not the only reason durability improved. The paper also highlights changes in the glass transition temperature (Tg), which relates to the thermal stability of the hole transport layer. The glass transition temperature indicates the range at which molecular motion in an amorphous material becomes active and the material softens more easily. In the hole transport layer, this temperature characteristic affects whether the film maintains its shape and electrical properties at high temperatures. The tBP used in the conventional recipe acts somewhat like a plasticizer in the spiro-OMeTAD film, lowering its glass transition temperature. When a film’s thermal stability drops, molecules are more likely to rearrange and aggregate in hot environments, which can damage conductive pathways and film uniformity. By contrast, the team reports that the new method, which advances oxidation without tBP, keeps the film’s glass transition temperature high. Suppressing lithium-ion migration while also improving the film’s own thermal stability is thought to have contributed to the improved durability. The new process also made the oxidation of spiro-OMeTAD more uniform and improved the electrical properties of the hole transport layer. The paper reports that microscope observations of the film and surface potential measurements showed that NiOₓ treatment made the material distribution more uniform and reduced local variations in conductivity. Such film uniformity is also important for extracting charge efficiently. The new process does more than reduce degradation-causing substances; it also improves the formation of the hole transport layer itself. The durability test is an important result, but it does not mean the lifespan problem of perovskite solar cells has been completely solved. Accelerated aging tests are a way to evaluate in a short time how much materials and devices degrade under particular environmental stresses. Yet solar cells used outdoors face not only heat and moisture but also light, temperature swings, and mechanical loads acting in combination. Even if a device shows high durability under fixed conditions, the result cannot be applied directly to long-term outdoor use. The 85°C, 85% relative humidity damp-heat test is widely used as a standard method for evaluating the moisture and heat resistance of solar modules. However, this damp-heat test was conducted in the dark with temperature and humidity held constant. Outdoor solar cells, by contrast, repeatedly warm up during the day and cool at night. Because they are stacks of multiple thin films with different coefficients of thermal expansion, such temperature changes can cause interface delamination and microscopic cracks. Outdoors, cells are also affected by the breakdown of organic materials from ultraviolet light, mechanical loads from wind, rain, and snow, electrical stress from fluctuating sunlight, and condensation. This damp-heat test did not reproduce all of these. And to say how many years of outdoor use 1,000 hours of accelerated testing corresponds to, degradation models tailored to the material composition and encapsulation method must be checked against data from real outdoor environments. Perovskite solar cells come in many material systems and device structures, and no single lifetime conversion factor common to all of them has been established. Caution is also needed in describing the lifespan of perovskite solar cells uniformly as “a few years.” Durability varies greatly with the perovskite composition, charge transport layer materials, device structure, encapsulation technology, and operating environment. When comparing lifetime data across studies, one must check whether test conditions and the definition of efficiency retention match. This study succeeded in suppressing an important degradation pathway in the hole transport layer, but confirming the outdoor durability required of commercial products will take further long-term testing. AD Announcing the results, Dr. SeJin Ahn expressed hope that progress toward solving the long-standing lifespan problem could become an important milestone in promoting the commercialization of perovskite and tandem solar cells. Tandem cells, which layer perovskite on top of silicon solar cells, are attracting particular attention because each layer can efficiently absorb different wavelengths of light, offering the potential to exceed the efficiency of single-junction silicon cells. Efficiencies above 30% are anticipated, but because multiple material layers are combined, the long-term stability of each layer will determine practical viability. Still, the conditions required of manufacturing differ greatly between cells a few millimeters across made in a lab and the large solar modules actually sold. Applying this result to industrial products will require not only materials chemistry but also establishing processes suited to mass production. In particular, how to incorporate solution treatment with catalyst powder and the filtration step into a production line is a key issue. The first challenge is scaling up the catalytic reaction and filtration steps. In the lab, a small amount of solution can be treated by adding NiOₓ powder, stirring briefly, and filtering with a syringe filter. In a factory handling large volumes of precursor solution, however, catalyst particles and solution must be brought into uniform contact while stable reaction conditions are maintained. It is also necessary to reliably remove NiOₓ particles and lithium-containing residues after the reaction while preventing filter clogging. Whether these steps can run continuously will affect production efficiency and quality stability. The second challenge is compatibility with large-area coating techniques. The spin coating used in this experiment forms a uniform thin film by spinning the substrate at high speed and using centrifugal force. But it makes poor use of material and is limited in how well it applies to large substrates, so mass production would likely consider methods such as slot-die coating or inkjet printing. Whether the tBP-free solution obtained from the new process can maintain appropriate viscosity, wettability, and drying characteristics with these coating methods remains to be verified. If scaling up to large areas causes unevenness in film thickness or doping, the efficiency and durability seen in the lab might not be reproduced. The third challenge is manufacturing cost and waste handling. In this process, NiOₓ powder is used as a catalyst and then removed by filtration together with lithium ions. Material, equipment, and waste disposal costs will differ depending on whether the powder is discarded or the captured lithium is separated and reused. Even if the catalyst brings large performance gains, high costs for the added step would limit the commercial advantage. Building a system capable of low-cost mass production while maintaining stable quality is essential. This study revisited the doping process long considered necessary for high-efficiency perovskite solar cells and showed that combining a redox reaction with physical filtration could deliver both performance and durability. In particular, the idea of using a material needed for the reaction midway through manufacturing and removing degradation-causing components before film formation offers a new option for designing hole transport layer materials. At the same time, this result is a demonstration with lab-scale single-junction cells, and applicability to commercial modules has not yet been confirmed. Going forward, the focus will be on verifying manufacturing quality and yield at larger areas, and on whether performance can be maintained over long periods in outdoor environments where multiple degradation factors overlap. Checked on 2026-10-27 AD Get the latest updates by email (Japanese newsletter) This newsletter is delivered in Japanese.
Data source: Omdia Note: 1Q16=first quarter 2016; 3Q26=third quarter 2026
In the third quarter of 2026 (3Q26), 23% of new light-duty vehicles sold in the United States were hybrid electric, battery electric, or plug-in hybrid electric vehicles, down slightly from 24% in 3Q25. Between 3Q25 and 3Q26, hybrid electric vehicles continued to gain market share, reaching 16% of light-duty vehicle sales. Growth of hybrid electric vehicle sales has slowed this quarter as the average transaction price for a new vehicle passed $50,000—the first time this price has been reached so far this year, according to Kelley Blue Book. Tags: sales, vehicles, transportation, electricity, gasoline
We estimate that U.S. generation from small-scale or rooftop solar photovoltaic systems (smaller than 1 megawatt of capacity) has increased from 18,812 gigawatthours (GWh) to 92,979 GWh over the last decade. The four states with the highest generation of small-scale solar in the country—California, Arizona, Texas, and Florida—are in regions with more abundant solar resources. Even though it is in a region with lower solar resources, New York ranks as the fifth-largest rooftop solar generation producer as a result of capacity growth supported by technology improvements and state incentives. Tags: solar, electricity, capacity
Data source: U.S. Energy Information Administration, Hourly Electric Grid Monitor Note: Data are the highest hourly load for a given day. ISO=independent system operator, ERCOT=Electric Reliability Council of Texas, SWPP=Southwest Power Pool
We expect energy expenditures this winter to vary because of diverging trends in energy prices among fuels and regional variation in forecast temperatures. We expect that lower prices for natural gas and propane will drive decreases in expenditures this year for the half of U.S. households heating with those fuels. Higher prices for electricity and heating oil drive increased expenditures for households heating with those fuels in our forecast. Tags: prices, WFO (Winter Fuels Outlook), STEO (Short-Term Energy Outlook), heating oil, weather, diesel
Data source: Bloomberg L.P. Note: 3Q26=third quarter of 2026
Petroleum markets in the third quarter of 2026 (3Q26) were characterized by increasing prices for crude oil and petroleum products amid persistent conflict in the Middle East. Tags: Saudi Arabia, Brent, crude oil, oil/petroleum, China
U.S. propane exports increased to 2 million barrels per day (b/d) in the first half of 2026, 11% more than during the same period in 2025. Increased U.S. propane production and changing trade flows, particularly increased exports to India and other countries in South Asia, drove propane exports to a record high of 2.1 million b/d in April 2026. Since then, total propane exports, including exports to India, have continued at levels well above the five-year average. Tags: propane, oil/petroleum
We estimate light-duty electric vehicles in the United States consumed 8% more electricity during the first six months of 2026 than in the last half of 2025 (2H25) in our Monthly Energy Review, down from the 13–24% growth seen in six-month periods in recent years. The slowing electric vehicle electricity consumption growth followed a decline in sales after U.S. federal tax credits expired in September 2025. Overall, U.S. light-duty electric vehicle electricity use has more than doubled since 1H23, totaling nearly 14 billion kilowatthours in 1H26. Tags: consumption/demand, electricity, vehicles
Data source: U.S. Energy Information Administration, Refinitiv Eikon
The Henry Hub natural gas spot price averaged $2.93 per million British thermal units from June through August, 6% less than the same period last year. Prices were lower this summer despite exceptionally hot weather that increased electricity demand for air conditioning. Natural gas-fired power plants often help meet higher demand during such periods. Tags: natural gas, Henry Hub This article has been reposted to correct a data point related to production per well.
Data source: Enverus Note: Crude oil and natural gas production in barrels of oil equivalent
Publicly traded companies represent a tiny share of the total number of companies producing crude oil and natural gas in the United States, but they make up a large share of U.S. production. In 2025, publicly traded companies accounted for just 2% of about 12,000 oil and natural gas producers but produced 68% of the crude oil and natural gas in the Lower 48 states. Tags: crude oil, natural gas
The price of distillate fuel oil, often sold as diesel, is driven by the price of crude oil, retail margins, distribution costs, taxes, and crack spreads, the indicator we use for refining margins. Tight global supplies of distillate fuel oil and elevated crude oil prices have driven prices higher in recent months. Tags: diesel, gasoline, crack spread, rail
Data source: U.S. Energy Information Administration, Liquefaction Capacity File Note: LNG=liquefied natural gas; FLNG=Floating Liquefied Natural Gas
On August 28, 2026, Cheniere Energy, Inc., completed its Corpus Christi Liquefaction Stage 3 Project (CCL Stage 3) in Texas, taking custody and control of the seventh and last liquefied natural gas (LNG) train in the project. Tags: LNG (liquefied natural gas), natural gas Crude oil, gasoline, heating oil, diesel, propane, and other liquids including biofuels and natural gas liquids. Exploration and reserves, storage, imports and exports, production, prices, sales. Sales, revenue and prices, power plants, fuel use, stocks, generation, trade, demand & emissions. Reserves, production, prices, employment and productivity, distribution, stocks, imports and exports. Uranium fuel, nuclear reactors, generation, spent fuel. Includes hydropower, solar, wind, geothermal, biomass and ethanol. Forms EIA uses to collect energy data including descriptions, links to survey instructions, and additional information. Comprehensive data summaries, comparisons, analysis, and projections integrated across all energy sources. Energy use in homes, commercial buildings, manufacturing, and transportation. State energy information, including overviews, rankings, data, and analyses. International energy information, including overviews, rankings, data, and analyses. Greenhouse gas data, voluntary reporting, electric power plant emissions. Monthly and yearly energy forecasts, analysis of energy topics, financial analysis, congressional reports. Special market analysis and/or data requests. International energy analyses. Tools to customize searches, view specific data sets, study detailed documentation, and access time-series data. EIA’s free and open data available as API, Excel add-in, bulk files, and widgets Come test out some of the products still in development and let us know what you think! EIA’s open source code, available on GitHub. Sign up for email subscriptions to receive messages about specific EIA products Subscribe to feeds for updates on EIA products including Today in Energy and What’s New.
Cubico Sustainable Investments has won planning approval for the 100MW Frodsham solar farm in Cheshire, England. The UK government granted a Development Consent Order application for the project today (27 October), alongside a separate permit awarded to Elements Green’s 800MW Great North Road solar farm in Nottinghamshire. Cubico’s PV array with battery energy storage is due to be located near the operational Frodsham onshore wind farm and Protos energy hub, and will connect into the existing Frodsham substation. The project will complement the north-west region’s existing low-carbon infrastructure and contribute to wider ambitions for establishing a hub of industrial decarbonisation, the developer added. Cubico Sustainable Investments UK country head Lucas Pegoraro said: “Securing development consent for Frodsham Solar is a significant milestone for Cubico and an important step forward in our ambition to deliver high-quality renewable energy infrastructure across the UK. “This achievement reflects the dedication, expertise and close collaboration of teams across Cubico, who have worked together to bring the project to this important stage. “Coupled with the project’s Phase 1 Gate 2 grid status, this milestone puts Frodsham Solar in a strong position to progress towards delivery.” The company’s UK development lead Joe Chambers added: “Securing consent is the culmination of several years of hard work, collaboration and engagement, and I’m incredibly proud of the team and everyone who has contributed to bringing Frodsham Solar to this stage. “Throughout the development process, we’ve worked closely with local communities, landowners and stakeholders to shape our proposals. “While there is still important work ahead, we’re excited to move into the next phase of the project and remain committed to working constructively with local stakeholders to ensure Frodsham Solar delivers lasting benefits for the area.” A DCO application was submitted to the UK Planning Inspectorate for examination in May 2025. The permitting authority sent its recommendation to the secretary of state for energy in July this year. Type above and press Enter to search. Press Esc to cancel.
The Western Australia government aims to achieve 75% renewable electricity on the South West Interconnected System (SWIS) by 2030-31, supported by large-scale solar, wind, and battery energy storage projects. The target doubles the previous goal of 40% and comes as the state prepares to exit coal-fired power by 2030. The state government said the renewable energy target (RET) is complemented by a Made in WA Energy Affordability Investment Program that will provide low-interest loans of up to AUD 15 million ($10.5 million) to help manufacturers install solar and battery systems and upgrade equipment to take advantage of cheaper energy. WA Energy Minister Amber-Jade Sanderson said the new 75% target is a “statement of intent” that is designed to encourage private sector investment. “We know that renewables, backed by storage and gas, is the cheapest and most reliable energy mix for Western Australia,” she said. “That’s why we’re powering ahead with our support for the energy opportunities of the future and encouraging businesses to invest in WA.” The government’s commitment has been welcomed by climate advocacy collaborative Solutions for Climate WA and its alliance of business, industry, investors, unions, and advocacy bodies. Solutions for Climate WA Director Jessica Panegyres said the new target is a key step forward for the state’s energy future. “[This] makes it clear that the future of our electricity system is renewables,” she said. “A renewable energy target sends an important signal to the businesses, investors, workers and communities who will deliver WA’s next generation of energy infrastructure.” Western Australia has some of the best renewable energy resources in the world and a strong industrial base and Panegyres said setting a target provides the certainty required to turn that potential into investment on the ground. Panegyres said the next task is making sure WA has a credible pathway to achieve its goal. “That means continuing to accelerate investment in renewable energy generation, storage and the transmission infrastructure needed to connect it, while ensuring communities and regional areas share in the benefits,” she said. Smart Energy Council (SEC) State Manager John Welch said WA’s new renewable energy target will advance the rate of growth for the state’s renewable energy industry “Our members across solar, wind and battery storage are ready to build in WA, and a target gives them a clear goal to build towards,” he said, adding that transmission will be critical to achieving the target. “The priority now is to keep the grid build moving and lock in dates for its next stages.” From pv magazine Australia This content is protected by copyright and may not be reused. If you want to cooperate with us and would like to reuse some of our content, please contact: [email protected]. This content is protected by copyright and may not be reused. If you want to cooperate with us and would like to reuse some of our content, please contact: [email protected]. Comments Please login to comment Wednesday, October 28, 2026 7:00 pm – 8:00 pm CEST, Berlin, Paris, Madrid Thursday, October 29, 2026 11:00 am – 12:00 pm CEST, Berlin, Paris, Madrid Monday, November 2, 2026 4:00 pm – 5:00 pm CEST, Berlin, Paris, Madrid Missed pv magazine USA Week 2026? Catch up on three days of expert discussions on U.S. solar manufacturing, distributed energy, and solar-plus-storage. Thursday, November 5, 2026 10:00 am – 11:00 pm CEST, Berlin, Paris, Madrid Monday, November 23, 2026 11:00 am – 12:00 pm CEST, Berlin, Paris, Madrid The new issue of pv magazine Global is out now! Available in print and digital – get your copy today! pv magazine hosts its four-day virtual event on European solar and energy storage, exploring market opportunities, solar-plus-storage business cases, technical quality, and cybersecurity in the years ahead.
New research from UNSW Sydney has found that smoke from major bushfires can significantly reduce solar electricity generation, even from more than 150km away. The researchers say better forecasting of smoke movements, more frequent panel inspections and cleaning, and changes to how solar panels operate could help solar farm operators prepare for these events and protect their equipment. The recommendations follow a study examining the effects of two major Australian bushfires—the 2019-2020 Black Summer fires and Victoria’s 2009 Black Saturday fires. Using historical weather and satellite data, the researchers modelled how smoke and airborne particles affected solar electricity generation and panel temperatures across south-eastern Australia. Dr Shukla Poddar from UNSW’s School of Photovoltaic and Renewable Energy Engineering says the research highlights the need to look beyond solar farms immediately surrounding a fire and consider where smoke is likely to travel. “We should start looking into things like trajectory modelling of the smoke and how long and far those smoke particles can be transported,” she says. “Extreme bushfires are becoming more frequent and intense in several regions, including Australia, California and southern Europe. Their impacts are not confined to the areas where fires burn: smoke from California’s 2020 wildfires reached Europe, while smoke from Spain’s 2025 fires travelled as far as the UK and northwestern Europe. “Although this particular study is based on two extreme bushfires in Australia, the same method and analysis can be done for other parts of the world.” Related article:Study finds coal pollution affects solar power output The UNSW study found that the impacts can extend well beyond the immediate fire zone. During the Black Summer bushfires, the researchers estimated that electricity generation fell by as much as 70% at locations within about 50km of fire hotspots during several consecutive days. In regions more than 150km from hotspots, the study estimated there were still losses of up to 30%. The effects varied with the severity of the fires and the weather. During the 2009 Black Saturday bushfires, the study estimated lower reductions of generated power of around 18% near fire hotspots and up to 10% in more distant regions. These figures are modelled estimates rather than measurements from individual solar farms. The researchers were unable to separate smoke-related losses from other factors, such as electricity generation being deliberately limited when the grid did not need all the power available. One of the researchers’ key recommendations is to combine bushfire information, wind patterns and smoke-trajectory modelling to help predict which solar farms are likely to be affected. Weather forecasts already help operators anticipate conditions such as high temperatures and strong winds. A similar system for smoke could give them advance warning that airborne particles are heading towards their facilities. That warning could allow operators to plan inspections, schedule cleaning or adjust the position of panels before smoke arrives. Poddar says historical wind patterns could also help operators understand which areas are more likely to be affected during bushfire conditions. “If operators got an alert that their solar farm might be impacted, they could potentially adapt some mitigation strategies, such as adjusting the panel angle where appropriate or being aware that additional cleaning may be required,” she says. The study also highlights the importance of panel maintenance, particularly during bushfire periods. Smoke particles can settle on solar panels, reducing the sunlight reaching their surfaces. If deposits accumulate unevenly, they may also create localised hot spots, where parts of a panel become much hotter than others. Over time, hot spots can damage cells and reduce their performance. Dr Poddar recommends more frequent cleaning when smoke is likely to affect a solar farm, alongside regular thermal inspections to identify unusually hot panels or electrical components. The researchers also recommend better remote monitoring and electrical fault detection, allowing operators to identify temperature anomalies and quickly isolate affected parts of a system. Managing grass and shrubs beneath panels, maintaining firebreaks and preparing bushfire management plans can help reduce the risk of fires starting or spreading within solar farms. Related article:Biosolar green roof boosts solar generation by up to 23.25% Many large solar farms use tracking systems that move panels to follow the sun throughout the day. Dr Poddar suggests operators could consider temporarily adjusting those angles during particularly hot periods, such as when bushfires are occurring, rather than always positioning panels for maximum sunlight. The aim would be to reduce heat exposure and potentially help loose particles move off panel surfaces. Such adjustments would involve a trade-off since panels may produce less electricity while turned slightly away from the sun. The research findings could also inform decisions about where to build future solar farms. Developers could assess the history of nearby bushfires and examine prevailing wind directions and likely smoke pathways before investing in a site. This framework can be combined to understand the frequent bushfire hotspots and air trajectory pathways as a pre-feasibility assessment for site selection of new solar farms. It is also beneficial for understanding optimal operational and management strategies for current operational solar farms that are in proximity to bushfire hotspots or can be affected due to aerosol dispersion and travel. Click Here to Subscribe Sign up to receive the latest Energy News emailed directly to your Inbox Click Here to Subscribe The final cost estimate for Snowy 2.0—the conversion of the original hydroelectric dam to a large pumped hydro energy storage scheme—will cost $22-25 billion. Will it be worth the price tag? #snowy2 #renewables #energytransition #pumpedhydro
Renewables Now is a leading business news source for renewable energy professionals globally. Trust us for comprehensive coverage of major deals, projects and industry trends. We’ve done this since 2009. Stay on top of sector news with with Renewables Now. Get access to extra articles and insights with our subscription plans and set up your own focused newsletters and alerts.
Data source: Omdia Note: 1Q16=first quarter 2016; 3Q26=third quarter 2026
In the third quarter of 2026 (3Q26), 23% of new light-duty vehicles sold in the United States were hybrid electric, battery electric, or plug-in hybrid electric vehicles, down slightly from 24% in 3Q25. Between 3Q25 and 3Q26, hybrid electric vehicles continued to gain market share, reaching 16% of light-duty vehicle sales. Growth of hybrid electric vehicle sales has slowed this quarter as the average transaction price for a new vehicle passed $50,000—the first time this price has been reached so far this year, according to Kelley Blue Book. Tags: sales, vehicles, transportation, electricity, gasoline
We estimate that U.S. generation from small-scale or rooftop solar photovoltaic systems (smaller than 1 megawatt of capacity) has increased from 18,812 gigawatthours (GWh) to 92,979 GWh over the last decade. The four states with the highest generation of small-scale solar in the country—California, Arizona, Texas, and Florida—are in regions with more abundant solar resources. Even though it is in a region with lower solar resources, New York ranks as the fifth-largest rooftop solar generation producer as a result of capacity growth supported by technology improvements and state incentives. Tags: solar, electricity, capacity
Data source: U.S. Energy Information Administration, Hourly Electric Grid Monitor Note: Data are the highest hourly load for a given day. ISO=independent system operator, ERCOT=Electric Reliability Council of Texas, SWPP=Southwest Power Pool
We expect energy expenditures this winter to vary because of diverging trends in energy prices among fuels and regional variation in forecast temperatures. We expect that lower prices for natural gas and propane will drive decreases in expenditures this year for the half of U.S. households heating with those fuels. Higher prices for electricity and heating oil drive increased expenditures for households heating with those fuels in our forecast. Tags: prices, WFO (Winter Fuels Outlook), STEO (Short-Term Energy Outlook), heating oil, weather, diesel
Data source: Bloomberg L.P. Note: 3Q26=third quarter of 2026
Petroleum markets in the third quarter of 2026 (3Q26) were characterized by increasing prices for crude oil and petroleum products amid persistent conflict in the Middle East. Tags: Saudi Arabia, Brent, crude oil, oil/petroleum, China
U.S. propane exports increased to 2 million barrels per day (b/d) in the first half of 2026, 11% more than during the same period in 2025. Increased U.S. propane production and changing trade flows, particularly increased exports to India and other countries in South Asia, drove propane exports to a record high of 2.1 million b/d in April 2026. Since then, total propane exports, including exports to India, have continued at levels well above the five-year average. Tags: propane, oil/petroleum
We estimate light-duty electric vehicles in the United States consumed 8% more electricity during the first six months of 2026 than in the last half of 2025 (2H25) in our Monthly Energy Review, down from the 13–24% growth seen in six-month periods in recent years. The slowing electric vehicle electricity consumption growth followed a decline in sales after U.S. federal tax credits expired in September 2025. Overall, U.S. light-duty electric vehicle electricity use has more than doubled since 1H23, totaling nearly 14 billion kilowatthours in 1H26. Tags: consumption/demand, electricity, vehicles
Data source: U.S. Energy Information Administration, Refinitiv Eikon
The Henry Hub natural gas spot price averaged $2.93 per million British thermal units from June through August, 6% less than the same period last year. Prices were lower this summer despite exceptionally hot weather that increased electricity demand for air conditioning. Natural gas-fired power plants often help meet higher demand during such periods. Tags: natural gas, Henry Hub This article has been reposted to correct a data point related to production per well.
Data source: Enverus Note: Crude oil and natural gas production in barrels of oil equivalent
Publicly traded companies represent a tiny share of the total number of companies producing crude oil and natural gas in the United States, but they make up a large share of U.S. production. In 2025, publicly traded companies accounted for just 2% of about 12,000 oil and natural gas producers but produced 68% of the crude oil and natural gas in the Lower 48 states. Tags: crude oil, natural gas
The price of distillate fuel oil, often sold as diesel, is driven by the price of crude oil, retail margins, distribution costs, taxes, and crack spreads, the indicator we use for refining margins. Tight global supplies of distillate fuel oil and elevated crude oil prices have driven prices higher in recent months. Tags: diesel, gasoline, crack spread, rail
Data source: U.S. Energy Information Administration, Liquefaction Capacity File Note: LNG=liquefied natural gas; FLNG=Floating Liquefied Natural Gas
On August 28, 2026, Cheniere Energy, Inc., completed its Corpus Christi Liquefaction Stage 3 Project (CCL Stage 3) in Texas, taking custody and control of the seventh and last liquefied natural gas (LNG) train in the project. Tags: LNG (liquefied natural gas), natural gas Crude oil, gasoline, heating oil, diesel, propane, and other liquids including biofuels and natural gas liquids. Exploration and reserves, storage, imports and exports, production, prices, sales. Sales, revenue and prices, power plants, fuel use, stocks, generation, trade, demand & emissions. Reserves, production, prices, employment and productivity, distribution, stocks, imports and exports. Uranium fuel, nuclear reactors, generation, spent fuel. Includes hydropower, solar, wind, geothermal, biomass and ethanol. Forms EIA uses to collect energy data including descriptions, links to survey instructions, and additional information. Comprehensive data summaries, comparisons, analysis, and projections integrated across all energy sources. Energy use in homes, commercial buildings, manufacturing, and transportation. State energy information, including overviews, rankings, data, and analyses. International energy information, including overviews, rankings, data, and analyses. Greenhouse gas data, voluntary reporting, electric power plant emissions. Monthly and yearly energy forecasts, analysis of energy topics, financial analysis, congressional reports. Special market analysis and/or data requests. International energy analyses. Tools to customize searches, view specific data sets, study detailed documentation, and access time-series data. EIA’s free and open data available as API, Excel add-in, bulk files, and widgets Come test out some of the products still in development and let us know what you think! EIA’s open source code, available on GitHub. Sign up for email subscriptions to receive messages about specific EIA products Subscribe to feeds for updates on EIA products including Today in Energy and What’s New.
Ionity has integrated a battery storage system at one of its sites for the first time, enabling the number of charging points at a charging park in Baden-Württemberg to be increased. But this is just the beginning, as Ionity now plans to install 50 battery storage systems at its charging parks next year. The use of battery storage systems is a key part of Ionity’s future expansion strategy, the company explained in response to a query from electrive. The charge point operator intends to deploy battery energy storage systems at selected locations to provide additional charging points and utilise the available energy more efficiently. At sites with photovoltaic systems, the batteries will also store locally generated solar power and make it available later for charging operations. The company’s first charging park with an integrated battery storage system has now been operational for a few days in Wertheim, Baden-Württemberg. The existing charging park, located between an exit of the A3 motorway, a McDonald’s, and the Wertheim Village outlet centre, has now been expanded. While there were previously four charging points available, Ionity has now expanded to six charging points using the battery storage system, all of which operate with Alpitronic HYC400 charging stations. Two additional charging points are set to follow soon, equipped with an ABB charging station with a peak power of 350 kW. In Wertheim, the primary purpose of the battery storage system is to bridge the time until the medium-voltage grid connection is upgraded. According to Ionity, this upgrade can take up to three years. The storage system is supplied by the Chinese manufacturer Sungrow and consists of four modular units with a total capacity of 1,028 kWh and a maximum power output of 500 kW. The batteries are housed as an external solution in switchgear cabinets on the charging park’s premises. The additional storage capacity can be used in conjunction with the existing grid connection. An intelligent energy management system is designed to allocate the available power between the grid connection, battery storage, and charging points as needed. In addition to bridging limited grid connection capacities, Ionity sees further applications: during periods of high utilisation at the charging park, the battery storage system can provide additional charging power while simultaneously reducing peak loads. Another project is under development in Hemsbach, Baden-Württemberg. This involves a completely new build: a fast-charging park with a photovoltaic canopy and battery storage system. The PV system is expected to achieve a capacity of more than 223 kWp, while the BESS will have a capacity of over 2 MWh. Unlike in Wertheim, locally generated solar power will also be stored and later used for charging at twelve fast-charging points. In the long term, Ionity aims to use its battery storage systems beyond immediate charging operations. The company is already working on deploying BESS for grid services in the future, thereby contributing to the stability of the power grid. Participation in energy trading is also a potential avenue. To this end, Ionity is further developing its intelligent energy management system, which is designed to coordinate the grid connection, storage, solar systems, and charging points. With scaling planned for 2027, which involves installing around 50 battery storage systems across Europe with a total capacity of more than 20 MWh, the use of BESS will become a central component of the fast-charging operator’s expansion strategy. There are several reasons for this step, as Christoph Strecker, Head of Rollout at Ionity, explained to electrive: “For us, it’s not just about building more charging points, but about creating the right charging infrastructure in the right locations and continuously improving the charging experience for our customers.” Strecker continues: “Battery storage systems play a key role in this: they enable us to open up new locations, use electricity more efficiently, and take on an active role in the energy system in the future. Wertheim is just the beginning. With the planned Europe-wide expansion, we want to take the next big step towards a smarter, more powerful, and more flexible charging infrastructure.” Battery storage technology can therefore benefit CPOs like Ionity in several ways: it can help bridge long waiting times for more powerful grid connections and bring charging parks into operation earlier or with more charging points. At the same time, it creates the conditions for more flexible electricity usage and, in the future, additional revenue opportunities through grid services and energy trading. An interesting detail: so far, Ionity has only used external BESS systems, even though there are charging stations with integrated battery storage available on the market. External solutions currently offer Ionity more flexibility, as they can supply multiple charging points independently of the charging hardware used and can be deployed for various use cases, the company explains. This is why Ionity’s current focus is on external battery storage systems. However, the company remains open to charging systems with integrated battery storage and is evaluating their use. Source: electrive – own research Your email address will not be published.Required fields are marked *
Go Solar Despite slower growth, small rooftop solar system installations continue to increase with support from state and program incentives Solar power
Electricity generation from small rooftop solar systems has increased nearly five fold since 2016 according to new data released by the federal Energy Information Administration. Energy generation from small rooftop solar systems, defined as being smaller than 1 megawatt of capacity, have gone from 18,812 gigawatthours (GWh) in 2016 to 92,979 GWh in 2025. California, Arizona, Texas, Florida and New York led states in terms of how much electricity they produced from rooftop solar. Although rooftop solar is still growing, the rate of growth has declined since 2022. In 2022, small-scale rooftop solar produced enough energy to power 5.7 million typical American homes, a ten-fold increase since 2012. A state’s level of rooftop solar adoption depends less on how much sunlight it receives than on whether the state has policies in place that encourage rooftop solar. For example, despite having relatively less solar resources than sun-kissed southern states, New York ranks in the top five states for rooftop solar. Growth in solar capacity in New York was driven by technological improvements and state incentives. Tax credits, property tax exemptions, net metering and other incentives all play an important role in driving new solar installations. “America needs to get to 100% renewable energy as quickly as possible,” said Johanna Neumann, Senior Director of the Campaign for 100% Renewable Energy at Environment America Research & Policy Center. “Every rooftop without solar panels is a missed opportunity to build a greener, healthier world.” Solar power Walmart can go big on solar. Its flat, often-sunny rooftops are a great place to accelerate solar energy. Add Your Name Clean Energy Associate, Environment America Research & Policy Center Solar power
The Noida-based group will set up the plant in Meedivemula village. According to sources, the State Investment Promotion Board, led by Andhra Pradesh CM N Chandrababu Naidu, has recommended allotting 290 acres to Jakson Integrated Solar for the project. The plant will be developed in three phases and employ about 2,000 people.
Hot on Web In Case you missed it Top Searched Companies Top Calculators Top Slideshow Private Companies Top Prime Articles Top Definitions Top Commodities Top Story Listing Latest News Follow us on: Find this comment offensive? Choose your reason below and click on the Report button. This will alert our moderators to take action Reason for reporting: Your Reason has been Reported to the admin. Log In/Connect with: Will be displayed Will not be displayed Will be displayed 15 Days Free: Unlock All ETPrime Exclusives, Market Tools & ePapers Trial offer expiring in00 : 05 : 00 Worry not. You’re just a step away. It seems like you’re already an ETPrime member with Login using your ET Prime credentials to enjoy all member benefits Log out of your current logged-in account and log in again using your ET Prime credentials to enjoy all member benefits. Big Price Drop! Flat 40% Off
Offer Exclusively For You Save up to Rs. 700/- ON ET PRIME MEMBERSHIP Offer Exclusively For You Get 1 Year Free With 1 and 2-Year ET prime membership Offer Exclusively For You Get 1 Year Free With 1 and 2-Year ET prime membership Offer Exclusively For You Get Flat 40% Off Then ₹ 1749 for 1 year Offer Exclusively For You ET Prime at ₹ 49 for 1 month Then ₹ 1749 for 1 year Special Offer Get flat 40% off on ETPrime
Connect with an ETPrime expert for personalized support and guidance What’s Included with ETPrime Membership Trump temper on H-1B visas is forcing Indians to do these things to stay put in US What Adani’s US indictment means for India Inc’s overseas fundraising Why veterans like Reliance, L&T are on acquisition spree? Aswath Damodaran has an answer. Will China’s dollar bond sale in Saudi Arabia trump the US in financial world? Huawei launches its own OS to compete with Google and Apple. But can it win beyond China? The problem with lab grown diamonds Why a falling rupee is a better option for the economy A list of top 20 momentum stocks that have delivered massive returns in one year Alpha Trade Get daily trade ideas from SEBI-registered research analysts. Investment Ideas Grow your wealth with stock ideas & sectoral trends. Stock Reports Plus All-in-one stock research with Stock Score, peer comparison & key signals. BigBull Portfolio Get to know where the market bulls are investing to identify the right stocks. Stock Analyzer Check the score based on the company’s fundamentals, solvency, growth, risk & ownership to decide the right stocks. Market Mood Analyze the market sentiments & identify the trend reversal for strategic decisions. Stock Talk Live at 9 AM Daily Ask your stock queries & get assured replies by ET appointed, SEBI registered experts. ePaper – Print View Read the PDF version of ET newspaper. Download & access it offline anytime. ePaper – Digital View Read your daily newspaper in Digital View & get it delivered to your inbox everyday. Wealth Edition Manage your money efficiently with this weekly money management guide. TOI ePaper Read the PDF version of TOI newspaper. Download & access it offline anytime. Deep Explainers Explore the In-depth explanation of complex topics for everyday life decisions. Health+ Stories Get fitter with daily health insights committed to your well-being. Personal Finance+ Stories Manage your wealth better with in-depth insights & updates on finance. Docubay Subscription Stream new documentaries from all across the world every day. Stories you might be interested in
Advertisement The Gulf conflict has disrupted global supply chains, pushed… REITs have changed the way commercial real estate is owned a… What really powers the cloud? Behind every Google search, A… What really powers the cloud? Behind every Google search, A… Luxury real estate is one of the most talked-about segments … Jakson Solar plans to invest up to INR 50 billion (USD 525.2 million) to establish 3 GW of solar cell manufacturing capacity and another 3 GW of solar ingot and wafer manufacturing capacity in India. Managing Director Ivan Saha said the company aims to commission the solar cell facility by December 2027, while the ingot and wafer plants are planned for the third quarter of fiscal year 2028. The investment will expand Jakson Solar’s existing 1.2 GW module manufacturing capacity as India seeks to strengthen domestic solar manufacturing and reduce dependence on imports from China. Representative image Indian solar manufacturer Jakson Solar plans to invest up to INR 50 billion (USD 525.2 million) to establish 3 gigawatts (GW) of solar cell manufacturing capacity and another 3 GW of solar ingot and wafer manufacturing capacity, according to a senior company executive. Managing Director Ivan Saha said the company aims to commission its 3 GW solar cell manufacturing facility by December 2027. The company plans to establish the 3 GW ingot and wafer manufacturing capacity by the third quarter of fiscal year 2028. Speaking on the sidelines of the Renewable Energy India Expo, Saha said the new facilities would primarily cater to the merchant market, where manufacturers sell their products to buyers rather than producing exclusively for their own operations. Jakson Solar already operates a solar module manufacturing plant with a capacity of 1.2 GW. Saha said the company had also secured equipment procurement tie-ups for the planned manufacturing facilities. The proposed investment comes as India seeks to expand its domestic solar manufacturing capabilities across the supply chain. Saha said developing a local manufacturing ecosystem covering different stages of solar production was necessary to reduce the risk of potential supply disruptions. Solar modules are assembled using solar cells, while ingots and wafers are intermediate materials used in the manufacturing of those cells. Building domestic capacity across these stages can help reduce reliance on imported components and materials. India is relying on solar energy to support its target of achieving net-zero emissions by 2070. The government has already mandated the use of domestically manufactured solar modules and solar cells under its local-content requirements. It has also established a framework to extend domestic-content requirements to solar ingots and wafers from June 1, 2028. The measure is intended to deepen domestic manufacturing and reduce India’s dependence on imports from China. Jakson Solar’s proposed facilities would add capacity at the upstream stages of solar manufacturing, complementing its existing module production operations. The planned commissioning timelines also place the investment ahead of the scheduled extension of local-content requirements to ingots and wafers. The planned investment reflects the growing focus on building a more complete solar manufacturing supply chain in India, from ingots and wafers to cells and finished modules. The success of the expansion will depend on the timely commissioning of the facilities, equipment installation and demand from the merchant market. The government’s upcoming local-content requirements could also influence sourcing decisions across the industry. Jakson Solar’s progress towards its 2027 and 2028 targets will indicate how quickly the company can expand its manufacturing operations in response to these policy changes. Source Reuters Have something to say? Post your comment 28th Oct, 2026 28th Oct, 2026 28th Oct, 2026 27th Oct, 2026 27th Oct, 2026 27th Oct, 2026 27th Oct, 2026 27th Oct, 2026 27th Oct, 2026 27th Oct, 2026
Advertisement Enter the email ID used to register with us This disclaimer (“Disclaimer”) is applicable to the entire Site. Upon entering the Site it is recommended that you immediately read the Terms and Conditions and Privacy Policy listed therein. Your continued usage of this Site will indicate your unconditional acceptance of the said Terms and Conditions and Privacy Policy. You hereby agree that Prop News Time reserves the right to modify at any time, the Terms and Conditions and Privacy Policy governing this Site without prior notification. Your usage of the Site implies that you will be bound by any such modification. You agree and acknowledge that it is your responsibility to periodically visit the Site and stay updated with the Terms and Conditions and Privacy Policy of the Website. The information contained in this Site has been provided by Prop News Time for information purposes only. This information does not constitute legal, professional or commercial advice. Communication, content and material within the Site may include photographs and conceptual representations of projects under development. All computer-generated images shown on the Site are only indicative of actual designs and are sourced from third party sites. The information on this Site may contain certain technical inaccuracies and typographical errors. Any errors or omissions brought to the attention of Prop News Time will be corrected as soon as possible. The content of this Site is being constantly modified to meet the terms, stipulations and recommendations of the Real Estate Regulation Act, 2016 (“RERA”) and rules made thereunder and may vary from the content available as of date. All content may be updated from time to time and may at times be out of date. Prop News Time accepts no responsibility for keeping the information on this website up to date or any liability whatsoever for any failure to do so. While every care has been taken to ensure that the content is useful, reliable and accurate, all content and information on the Site is provided on an “as is” and “as available” basis. Prop News Time does not accept any responsibility or liability with regard to the content, accuracy, legality and reliability of the information provided herein, or, for any loss or damage caused arising directly or indirectly in connection with reliance on the use of such information. No information given under this Site creates a warranty or expands the scope of any warranty that cannot be disclaimed under applicable law. This Site provides links to other websites owned by third parties. Any reference or mention of third-party websites, projects or services is for purely informational purposes only. This information does not constitute either an endorsement or a recommendation. Prop News Time accepts no responsibility for the content, reliability and information provided on these third-party websites. Prop News Time will not be held liable for any personal information or data collected by these third parties or for any virus or destructive properties that may be present on these third-party sites. Your use of the Site is solely at your own risk. You agree and acknowledge that you are solely responsible for any action you take based upon this content and that Prop News Time is not liable for the same. All details in the form of news stories, photos and videos provided on this Site are updated on the basis of information available from the respective developers/owners/promoters. All such information will not be construed as an advertisement. This Site is for guidance only. Your use of this Site – including any suggestions set out in the Site and or any use of the resources available on this Site, do not create any professional–client relationship between you and Prop News Time. Prop News Time cannot accept you as a client until certain formalities and requirements are met. Cookie Disclaimer We use cookies to give you the best possible service while using our website, please accept it and continue browsing if you’re happy with this. For more information see our Privacy Policy
PropNewsTime is a dedicated property news website that covers the latest events, stories, updates and occurrences in the industry. We are an unbiased entity not affiliated with any builder, broking firm and banking institution. This action is final. Once your account and all associated personal data has been deleted, you have to again register and all your data will be lost.






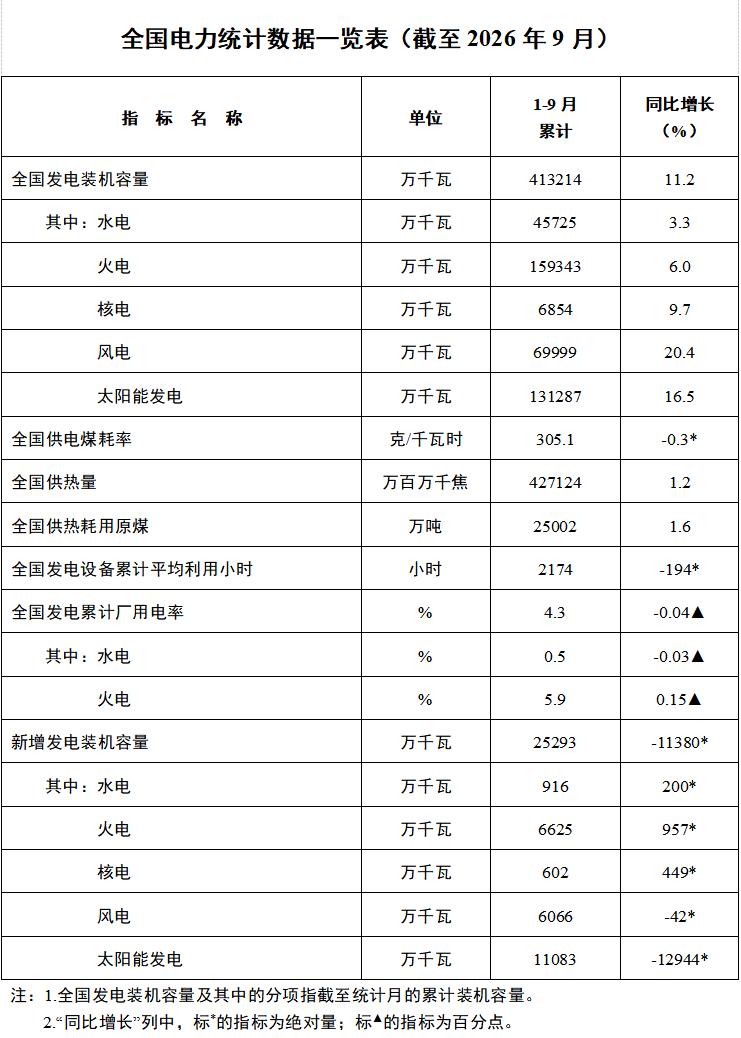
 October 7, 2026


 ETPrime Membership


You must be logged in to post a comment.